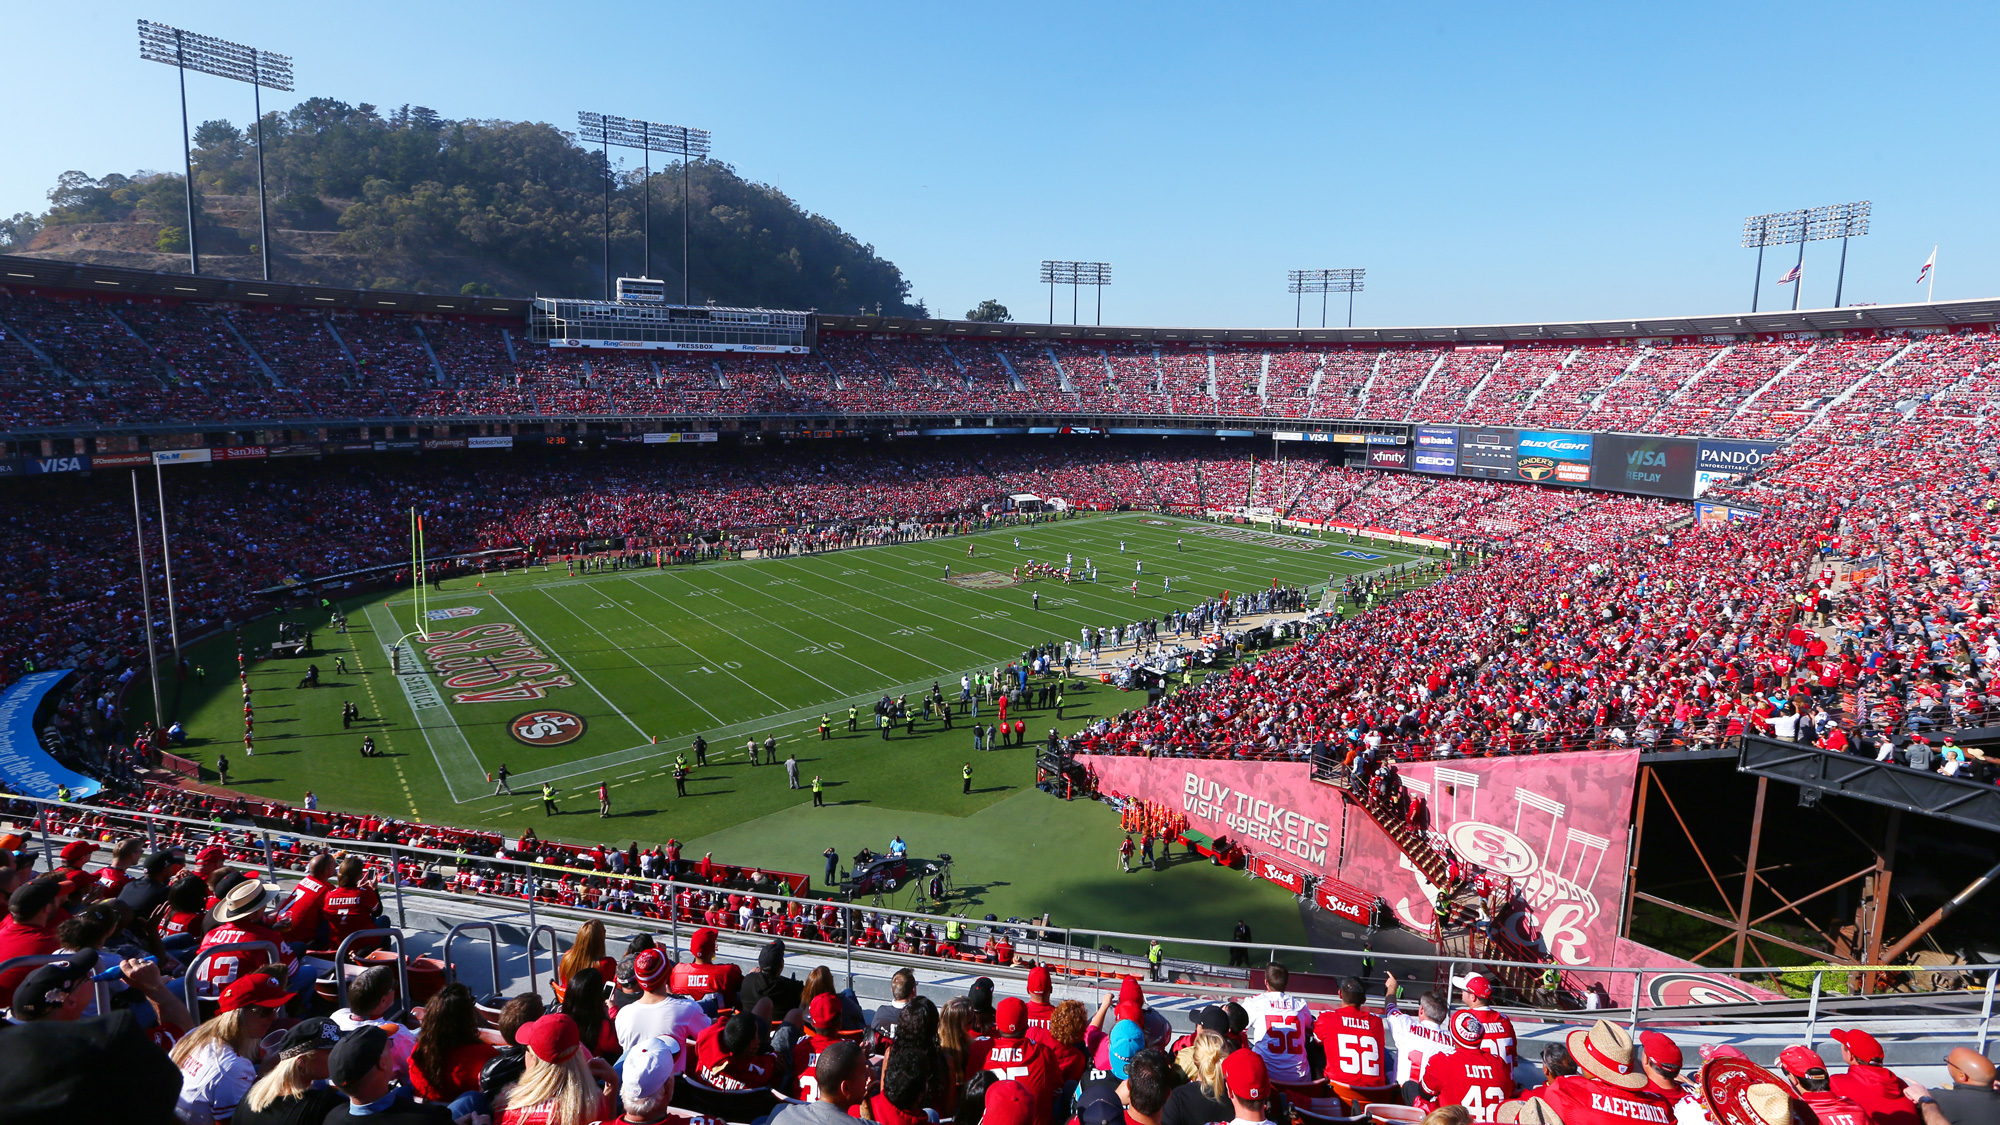
Tennessee Titans @ San Francisco 49ers
Game Leaders
Team Stats
315
Total Yards
358
0
Turnovers
4
14
1st Downs
25
8-58
Penalties
5-25
4/12
3rd Down
4/13
1/1
4th Down
3/3
3/5
Red Zone
3/5
26:10
Possession
33:50
Game Information
San Francisco, CA

Referee:Carl Cheffers

1st Quarter
Field Goal
8:41 - 1st
0
TEN
3
SF
Joe Nedney 40 Yard Field Goal is Good
8 plays, 52 yards, 3:40
Field Goal
6:00 - 1st
3
TEN
3
SF
Rob Bironas 21 Yard Field Goal is Good
7 plays, 77 yards, 2:39
2nd Quarter
Touchdown
15:00 - 2nd
9
TEN
3
SF
Vince Young 7 Yard Run
6 plays, 24 yards, 3:05
Extra Point
13:08 - 2nd
10
TEN
3
SF
Rob Bironas Kick is Good
6 plays, 24 yards, 3:05
Touchdown
9:35 - 2nd
10
TEN
9
SF
Frank Gore 3 Yard Run
6 plays, 69 yards, 3:37
Extra Point
9:31 - 2nd
10
TEN
10
SF
Joe Nedney Kick is Good
6 plays, 69 yards, 3:37
Touchdown
0:28 - 2nd
10
TEN
17
SF
Jason Hill 12 Yard Pass From Alex Smith
9 plays, 82 yards, 3:12
Extra Point
0:20 - 2nd
10
TEN
17
SF
Joe Nedney Kick is Good
9 plays, 82 yards, 3:12
3rd Quarter
Touchdown
5:44 - 3rd
16
TEN
17
SF
Chris Johnson 1 Yard Run
7 plays, 36 yards, 3:06
Extra Point
5:40 - 3rd
17
TEN
17
SF
Rob Bironas Kick is Good
7 plays, 36 yards, 3:06
4th Quarter
Field Goal
10:59 - 4th
17
TEN
20
SF
Joe Nedney 25 Yard Field Goal is Good
15 plays, 66 yards, 9:45
Touchdown
7:18 - 4th
23
TEN
20
SF
Chris Johnson 2 Yard Run
8 plays, 121 yards, 3:44
Extra Point
7:11 - 4th
24
TEN
20
SF
Rob Bironas Kick is Good
8 plays, 121 yards, 3:44
Field Goal
3:09 - 4th
27
TEN
20
SF
Rob Bironas 28 Yard Field Goal is Good
7 plays, 29 yards, 3:07
Touchdown
3:00 - 4th
33
TEN
20
SF
Cortland Finnegan 39 Yard Interception Return
1 play, 28 yards, 0:00
Extra Point
2:51 - 4th
34
TEN
20
SF
Rob Bironas Kick is Good
11 plays, 77 yards, 2:12
Touchdown
0:44 - 4th
34
TEN
26
SF
Jason Hill 3 Yard Pass From Alex Smith
11 plays, 77 yards, 2:12
Extra Point
0:39 - 4th
34
TEN
27
SF
Joe Nedney Kick is Good
11 plays, 77 yards, 2:12
Data is currently unavailable.
2025 Standings
American Football Conference
| AFC South | W | L | T | PCT | PF | PA |
|---|---|---|---|---|---|---|
| Jacksonville | 13 | 4 | 0 | .765 | 474 | 336 |
| Houston | 12 | 5 | 0 | .706 | 404 | 295 |
| Indianapolis | 8 | 9 | 0 | .471 | 466 | 412 |
| Tennessee | 3 | 14 | 0 | .176 | 284 | 478 |
National Football Conference
| NFC West | W | L | T | PCT | PF | PA |
|---|---|---|---|---|---|---|
| Seattle | 14 | 3 | 0 | .824 | 483 | 292 |
| Los Angeles | 12 | 5 | 0 | .706 | 518 | 346 |
| San Francisco | 12 | 5 | 0 | .706 | 437 | 371 |
| Arizona | 3 | 14 | 0 | .176 | 355 | 488 |
NFL News

Did the Patriots coaches do enough to help Drake Maye?
Domonique Foxworth, Dan Orlovsky and Tedy Bruschi discuss what caused the Patriots' struggles against the Seahawks' defense.
1m

NFL head coaches who have been with the most teams
A selection of NFL coaches have exceled at leading multiple franchises. Check out who has been with the most teams throughout NFL history now.
35m

NFL coaching turnover since 2002: Highest to lowest teams
Since 2002, the Raiders have had 13 head coaches. Conversely, the Steelers have only had three. Check out the breakdown by team now.
1h
GAMBLING PROBLEM? CALL 1-800-GAMBLER, (800) 327-5050 or visit gamblinghelplinema.org (MA). Call 877-8-HOPENY/text HOPENY (467369) (NY). Please Gamble Responsibly. 888-789-7777/visit ccpg.org (CT), or visit www.mdgamblinghelp.org (MD). 21+ and present in most states. (18+ DC/KY/NH/WY). Void in ONT/OR/NH. Eligibility restrictions apply. On behalf of Boot Hill Casino & Resort (KS). Terms: sportsbook.draftkings.com/promos.
Copyright: © 2026 ESPN Enterprises, Inc. All rights reserved.


