
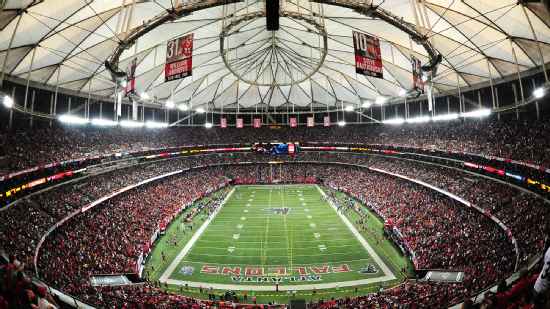
Arizona Cardinals @ Atlanta Falcons

1-3, 0-2 Away
10
1-3, 0-2 Away

3-1, 2-0 Home
32
3-1, 2-0 Home
Game Leaders


Team Stats


187
Total Yards
405
4
Turnovers
1
14
1st Downs
19
4-19
Penalties
5-40
4/12
3rd Down
4/14
1/1
4th Down
1/1
0/1
Red Zone
0/6
28:33
Possession
31:27
Game Information
Atlanta, GA
Referee:Gene Steratore
Team Stats
 | | |
|---|---|---|
| 1st Downs | 14 | 19 |
| Passing 1st downs | 8 | 5 |
| Rushing 1st downs | 3 | 12 |
| 1st downs from penalties | 3 | 2 |
| 3rd down efficiency | 4-12 | 4-14 |
| 4th down efficiency | 1-1 | 1-1 |
| Total Plays | 57 | 64 |
| Total Yards | 187 | 405 |
| Total Drives | 12 | 12 |
| Yards per Play | 3.3 | 6.3 |
| Passing | 161 | 143 |
| Comp/Att | 17/29 | 13/22 |
| Yards per pass | 4.9 | 6.0 |
| Interceptions thrown | 2 | 1 |
| Sacks-Yards Lost | 4-21 | 2-10 |
| Rushing | 26 | 262 |
| Rushing Attempts | 24 | 40 |
| Yards per rush | 1.1 | 6.6 |
| Red Zone (Made-Att) | 0-1 | 0-6 |
| Penalties | 4-19 | 5-40 |
| Turnovers | 4 | 1 |
| Fumbles lost | 2 | 0 |
| Interceptions thrown | 2 | 1 |
| Defensive / Special Teams TDs | 2 | 2 |
| Possession | 28:33 | 31:27 |
2025 Standings
National Football Conference
| NFC West | W | L | T | PCT | PF | PA |
|---|---|---|---|---|---|---|
| Seattle | 14 | 3 | 0 | .824 | 483 | 292 |
| Los Angeles | 12 | 5 | 0 | .706 | 518 | 346 |
| San Francisco | 12 | 5 | 0 | .706 | 437 | 371 |
| Arizona | 3 | 14 | 0 | .176 | 355 | 488 |
| NFC South | W | L | T | PCT | PF | PA |
|---|---|---|---|---|---|---|
| Carolina | 8 | 9 | 0 | .471 | 311 | 380 |
| Tampa Bay | 8 | 9 | 0 | .471 | 380 | 411 |
| Atlanta | 8 | 9 | 0 | .471 | 353 | 401 |
| New Orleans | 6 | 11 | 0 | .353 | 306 | 383 |
NFL News

Fantasy football buzz: Why drafting Jonathan Taylor carries risk
Liz Loza gives a history lesson to explain why the Colts' star could disappoint fantasy managers this season.
1h

What does C.J. Stroud need to prove this season?
What does C.J. Stroud need to prove this season?
2h
Why 'Get Up' crew wants to see Shedeur Sanders start for Browns
Why 'Get Up' crew wants to see Shedeur Sanders start for Browns
2h