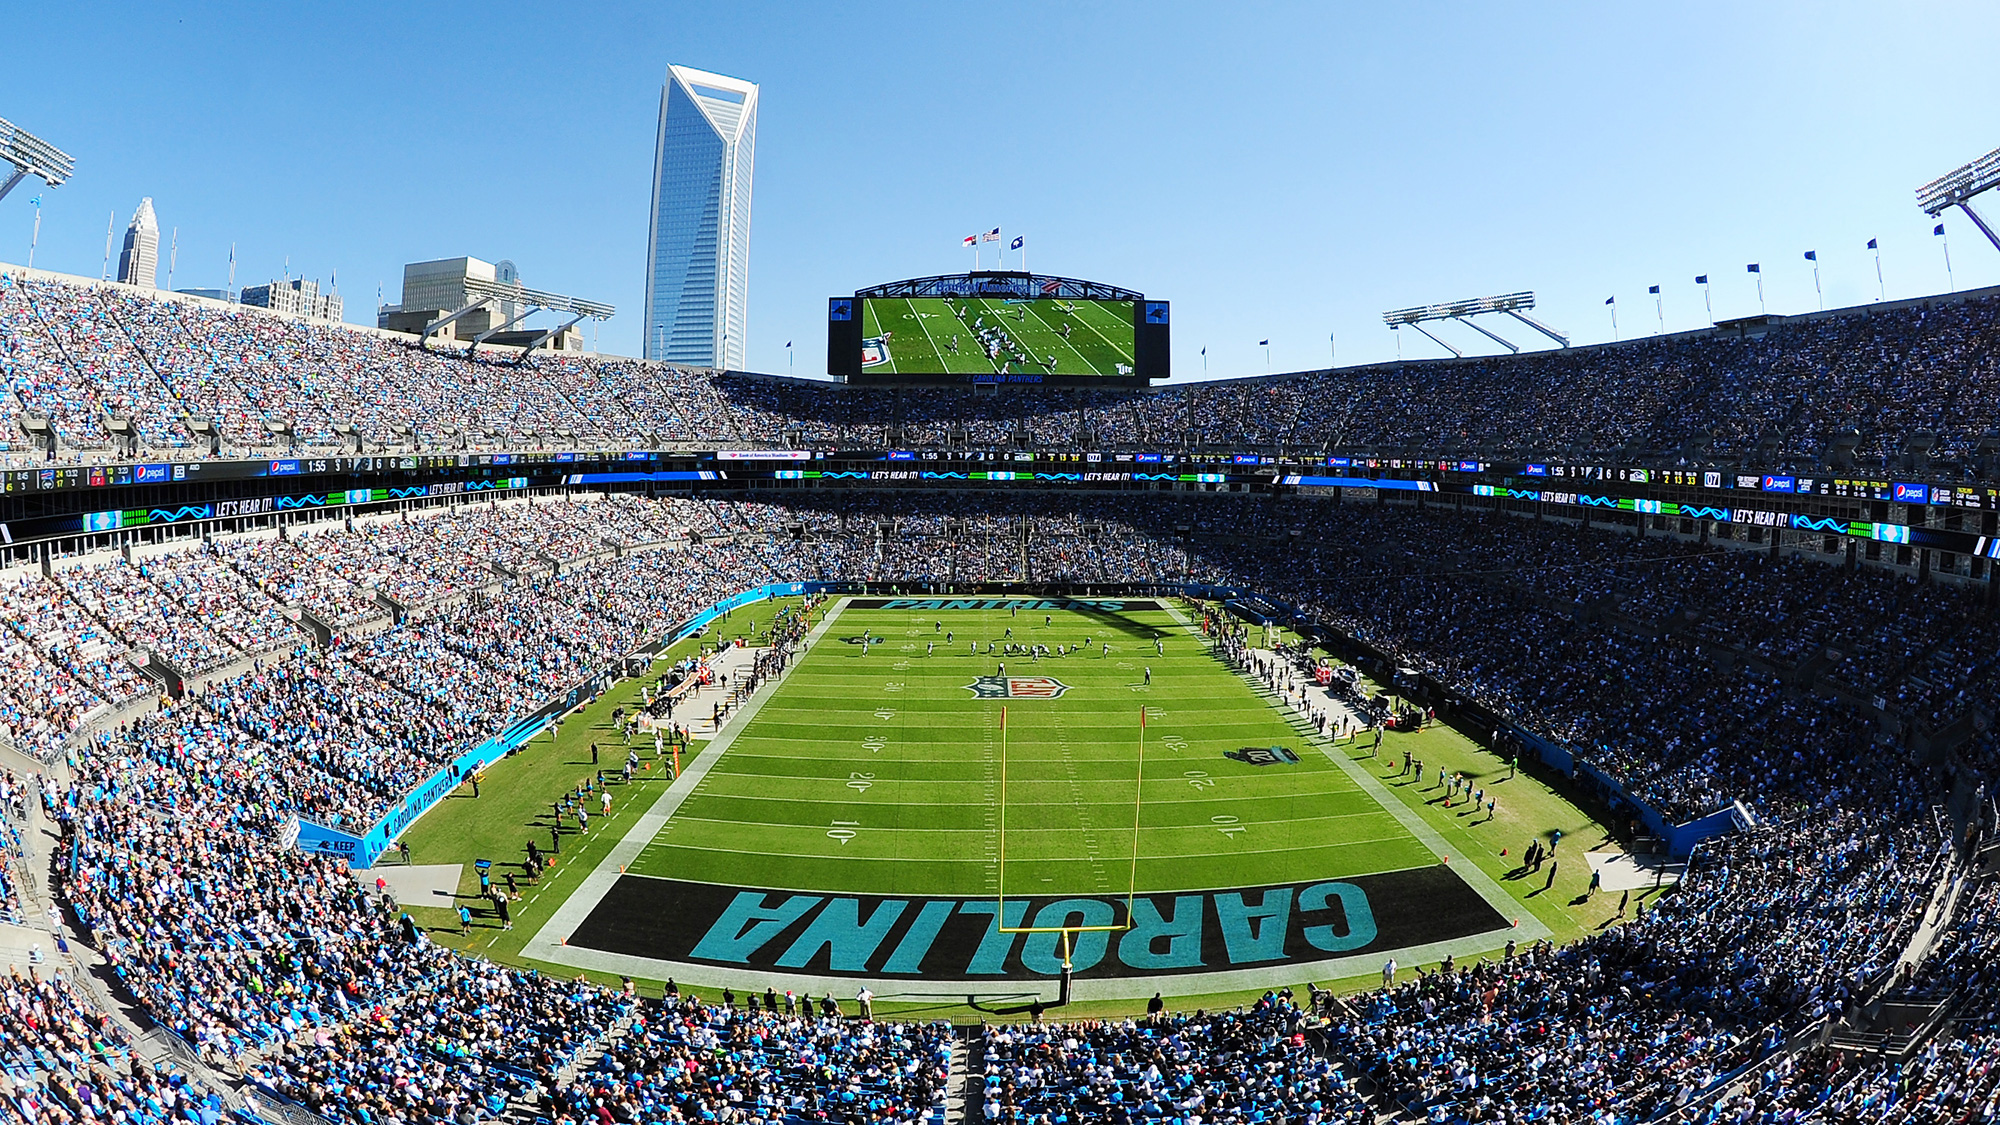
Dallas Cowboys @ Carolina Panthers
Game Leaders
Team Stats
414
Total Yards
204
1
Turnovers
3
27
1st Downs
16
9-86
Penalties
5-44
6/14
3rd Down
3/9
0/0
4th Down
0/0
4/5
Red Zone
1/1
38:16
Possession
21:44
Game Information
Charlotte, NC

Referee:Scott Green

Team Stats
| 1st Downs | 27 | 16 |
| Passing 1st downs | 15 | 10 |
| Rushing 1st downs | 10 | 3 |
| 1st downs from penalties | 2 | 3 |
| 3rd down efficiency | 6-14 | 3-9 |
| 4th down efficiency | 0-0 | 0-0 |
| Total Plays | 76 | 51 |
| Total Yards | 414 | 204 |
| Total Drives | 12 | 12 |
| Yards per Play | 5.4 | 4.0 |
| Passing | 258 | 128 |
| Comp/Att | 24/36 | 17/31 |
| Yards per pass | 6.8 | 3.8 |
| Interceptions thrown | 1 | 1 |
| Sacks-Yards Lost | 2-12 | 3-21 |
| Rushing | 156 | 76 |
| Rushing Attempts | 38 | 17 |
| Yards per rush | 4.1 | 4.5 |
| Red Zone (Made-Att) | 4-5 | 1-1 |
| Penalties | 9-86 | 5-44 |
| Turnovers | 1 | 3 |
| Fumbles lost | 0 | 2 |
| Interceptions thrown | 1 | 1 |
| Defensive / Special Teams TDs | 0 | 0 |
| Possession | 38:16 | 21:44 |
2025 Standings
National Football Conference
| NFC East | W | L | T | PCT | PF | PA |
|---|---|---|---|---|---|---|
| Philadelphia | 11 | 6 | 0 | .647 | 379 | 325 |
| Dallas | 7 | 9 | 1 | .441 | 471 | 511 |
| Washington | 5 | 12 | 0 | .294 | 356 | 451 |
| New York | 4 | 13 | 0 | .235 | 381 | 439 |
| NFC South | W | L | T | PCT | PF | PA |
|---|---|---|---|---|---|---|
| Carolina | 8 | 9 | 0 | .471 | 311 | 380 |
| Tampa Bay | 8 | 9 | 0 | .471 | 380 | 411 |
| Atlanta | 8 | 9 | 0 | .471 | 353 | 401 |
| New Orleans | 6 | 11 | 0 | .353 | 306 | 383 |
NFL News

What's next for Rams at right tackle after Rob Havenstein's retirement
Sarah Barshop discusses the Rams' options at right tackle following Rob Havenstein's retirement.
5h

Patriots to move DC Williams to new role, source says
The Patriots are opening their defensive coordinator position by moving Terrell Williams to a high-ranking role on coach Mike Vrabel's staff, a source confirmed.
5h

Sources: Raiders expected to hire McCoy as assistant head coach
The Raiders are expected to hire Mike McCoy as the assistant head coach under Klint Kubiak, sources told ESPN.
6h
GAMBLING PROBLEM? CALL 1-800-GAMBLER, (800) 327-5050 or visit gamblinghelplinema.org (MA). Call 877-8-HOPENY/text HOPENY (467369) (NY). Please Gamble Responsibly. 888-789-7777/visit ccpg.org (CT), or visit www.mdgamblinghelp.org (MD). 21+ and present in most states. (18+ DC/KY/NH/WY). Void in ONT/OR/NH. Eligibility restrictions apply. On behalf of Boot Hill Casino & Resort (KS). Terms: sportsbook.draftkings.com/promos.
Copyright: © 2026 ESPN Enterprises, Inc. All rights reserved.


