
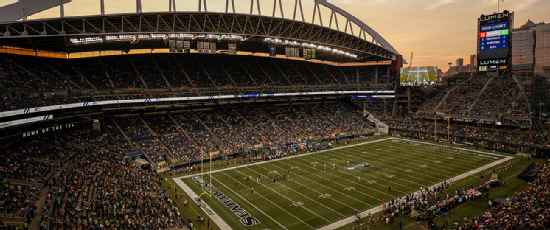
Baltimore Ravens @ Seattle Seahawks

6-3, 2-3 Away
17
6-3, 2-3 Away

3-6, 2-2 Home
22
3-6, 2-2 Home
Game Leaders


Team Stats


323
Total Yards
327
3
Turnovers
0
25
1st Downs
16
4-34
Penalties
13-100
5/12
3rd Down
5/16
1/1
4th Down
1/1
2/3
Red Zone
1/5
24:59
Possession
35:01
Game Information
Seattle, WA
Referee:Scott Green
Team Stats
 | | |
|---|---|---|
| 1st Downs | 25 | 16 |
| Passing 1st downs | 14 | 9 |
| Rushing 1st downs | 7 | 7 |
| 1st downs from penalties | 4 | 0 |
| 3rd down efficiency | 5-12 | 5-16 |
| 4th down efficiency | 1-1 | 1-1 |
| Total Plays | 66 | 70 |
| Total Yards | 323 | 327 |
| Total Drives | 10 | 13 |
| Yards per Play | 4.9 | 4.7 |
| Passing | 248 | 208 |
| Comp/Att | 30/53 | 17/27 |
| Yards per pass | 4.6 | 7.4 |
| Interceptions thrown | 1 | 0 |
| Sacks-Yards Lost | 1-8 | 1-9 |
| Rushing | 75 | 119 |
| Rushing Attempts | 12 | 42 |
| Yards per rush | 6.3 | 2.8 |
| Red Zone (Made-Att) | 2-3 | 1-5 |
| Penalties | 4-34 | 13-100 |
| Turnovers | 3 | 0 |
| Fumbles lost | 2 | 0 |
| Interceptions thrown | 1 | 0 |
| Defensive / Special Teams TDs | 0 | 0 |
| Possession | 24:59 | 35:01 |
2025 Standings
American Football Conference
| AFC North | W | L | T | PCT | PF | PA |
|---|---|---|---|---|---|---|
| Pittsburgh | 10 | 7 | 0 | .588 | 397 | 387 |
| Baltimore | 8 | 9 | 0 | .471 | 424 | 398 |
| Cincinnati | 6 | 11 | 0 | .353 | 414 | 492 |
| Cleveland | 5 | 12 | 0 | .294 | 279 | 379 |
National Football Conference
| NFC West | W | L | T | PCT | PF | PA |
|---|---|---|---|---|---|---|
| Seattle | 14 | 3 | 0 | .824 | 483 | 292 |
| Los Angeles | 12 | 5 | 0 | .706 | 518 | 346 |
| San Francisco | 12 | 5 | 0 | .706 | 437 | 371 |
| Arizona | 3 | 14 | 0 | .176 | 355 | 488 |
NFL News

2026 Fantasy Football Draft Guide: Rankings, mock drafts and analysis
Your one-stop shop as you prep for draft season, including rankings, projections and analysis.
9h

Late Cowboys player Marshawn Kneeland diagnosed with CTE
Former Cowboys defensive end Marshawn Kneeland has been posthumously diagnosed with CTE.
9h
Fantasy team tiers: Which NFL squad has the most fantasy value?
Eric Karabell places NFL teams in tiers for fantasy value this season. Which teams should you want a piece of?
9h