
New England Patriots @ Houston Texans

9-3, 3-3 Away
34
9-3, 3-3 Away

2-10, 1-6 Home
31
2-10, 1-6 Home
Game Leaders


371
T. BradyQB
29/41, 2 TD, 1 INT
371

272
C. KeenumQB
15/30, 1 INT
272

44
L. BlountRB
12 CAR, 1 TD
44

102
B. TateRB
22 CAR, 3 TD
102

127
R. GronkowskiTE
6 REC, 1 TD
127

121
A. JohnsonWR
8 REC
121

1
I. SopoagaDT
1

0.5
J. TarpinianLB
0.5

7
D. HightowerLB
5 SOLO
7

9
D. SharptonLB
6 SOLO
9
Team Stats


453
Total Yards
385
1
Turnovers
1
28
1st Downs
19
0-0
Penalties
2-25
5/12
3rd Down
5/11
0/0
4th Down
0/1
3/3
Red Zone
3/3
33:46
Possession
26:14
Game Information
Houston, TX
Referee:Pete Morelli
Team Stats
 | | |
|---|---|---|
| 1st Downs | 28 | 19 |
| Passing 1st downs | 20 | 11 |
| Rushing 1st downs | 7 | 8 |
| 1st downs from penalties | 1 | 0 |
| 3rd down efficiency | 5-12 | 5-11 |
| 4th down efficiency | 0-0 | 0-1 |
| Total Plays | 69 | 59 |
| Total Yards | 453 | 385 |
| Total Drives | 11 | 12 |
| Yards per Play | 6.6 | 6.5 |
| Passing | 365 | 264 |
| Comp/Att | 29/41 | 15/30 |
| Yards per pass | 8.7 | 8.5 |
| Interceptions thrown | 1 | 1 |
| Sacks-Yards Lost | 1-6 | 1-8 |
| Rushing | 88 | 121 |
| Rushing Attempts | 27 | 28 |
| Yards per rush | 3.3 | 4.3 |
| Red Zone (Made-Att) | 3-3 | 3-3 |
| Penalties | 0-0 | 2-25 |
| Turnovers | 1 | 1 |
| Fumbles lost | 0 | 0 |
| Interceptions thrown | 1 | 1 |
| Defensive / Special Teams TDs | 0 | 0 |
| Possession | 33:46 | 26:14 |
2025 Standings
American Football Conference
| AFC East | W | L | T | PCT | PF | PA |
|---|---|---|---|---|---|---|
| New England | 14 | 3 | 0 | .824 | 490 | 320 |
| Buffalo | 12 | 5 | 0 | .706 | 481 | 365 |
| Miami | 7 | 10 | 0 | .412 | 347 | 424 |
| New York | 3 | 14 | 0 | .176 | 300 | 503 |
| AFC South | W | L | T | PCT | PF | PA |
|---|---|---|---|---|---|---|
| Jacksonville | 13 | 4 | 0 | .765 | 474 | 336 |
| Houston | 12 | 5 | 0 | .706 | 404 | 295 |
| Indianapolis | 8 | 9 | 0 | .471 | 466 | 412 |
| Tennessee | 3 | 14 | 0 | .176 | 284 | 478 |
NFL News
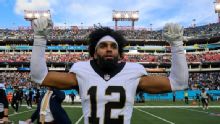
Has Saints' WRs room leveled up with Chris Olave, Jordyn Tyson?
Kellen Moore & Co. are stoked about New Orleans' receivers: 'Let's just start building this in the right way.'
5h
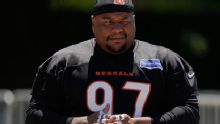
Why has Dexter Lawrence's production dipped recently? Ask him
The veteran pass rusher doesn't hold back when discussing his past with the Giants and his future in Cincinnati.
5h
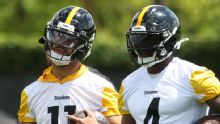
Steelers revamp WR unit: 'Not short-handed on pass catchers'
Pittsburgh enters training camp with a WR corps that coach Mike McCarthy called interchangeable and dynamic.
5h