
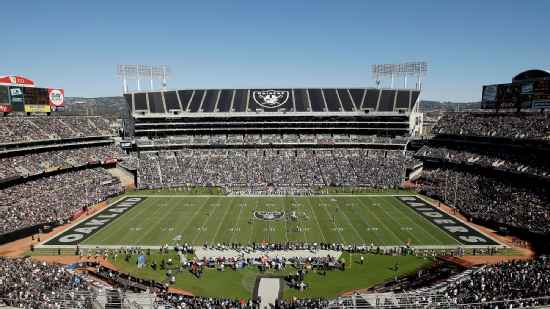
San Francisco 49ers @ Oakland Raiders

7-6, 4-3 Away
13
7-6, 4-3 Away

2-11, 2-5 Home
24
2-11, 2-5 Home
Game Leaders


Team Stats


248
Total Yards
330
2
Turnovers
0
18
1st Downs
19
7-50
Penalties
10-84
3/11
3rd Down
6/13
1/1
4th Down
0/1
1/2
Red Zone
3/4
27:05
Possession
32:55
Game Information
Oakland, CA
Side Judge:James Coleman
Referee:Terry McAulay
Field Judge:Dyrol Prioleau
Line Judge:Tom Stephan
Back Judge:Greg Steed
Down Judge:Greg Bradley
Umpire:Bryan Neale
Team Stats
 | | |
|---|---|---|
| 1st Downs | 18 | 19 |
| Passing 1st downs | 10 | 13 |
| Rushing 1st downs | 5 | 5 |
| 1st downs from penalties | 3 | 1 |
| 3rd down efficiency | 3-11 | 6-13 |
| 4th down efficiency | 1-1 | 0-1 |
| Total Plays | 56 | 60 |
| Total Yards | 248 | 330 |
| Total Drives | 11 | 11 |
| Yards per Play | 4.4 | 5.5 |
| Passing | 151 | 245 |
| Comp/Att | 18/33 | 22/28 |
| Yards per pass | 4.0 | 8.4 |
| Interceptions thrown | 2 | 0 |
| Sacks-Yards Lost | 5-23 | 1-9 |
| Rushing | 97 | 85 |
| Rushing Attempts | 18 | 31 |
| Yards per rush | 5.4 | 2.7 |
| Red Zone (Made-Att) | 1-2 | 3-4 |
| Penalties | 7-50 | 10-84 |
| Turnovers | 2 | 0 |
| Fumbles lost | 0 | 0 |
| Interceptions thrown | 2 | 0 |
| Defensive / Special Teams TDs | 0 | 0 |
| Possession | 27:05 | 32:55 |
2025 Standings
National Football Conference
| NFC West | W | L | T | PCT | PF | PA |
|---|---|---|---|---|---|---|
| Seattle | 14 | 3 | 0 | .824 | 483 | 292 |
| Los Angeles | 12 | 5 | 0 | .706 | 518 | 346 |
| San Francisco | 12 | 5 | 0 | .706 | 437 | 371 |
| Arizona | 3 | 14 | 0 | .176 | 355 | 488 |
NFL News
Is Mike Evans worth the risk in fantasy?
Is Mike Evans worth the risk in fantasy?
13h

Fantasy football 2026 defensive depth charts
Your guide to each NFL team's most valuable fantasy defensive players for the 2026 season.
17h

Fantasy football 2026 offensive depth charts
Your guide to each NFL team's most valuable offensive players from a fantasy standpoint for the 2026 season.
17h