
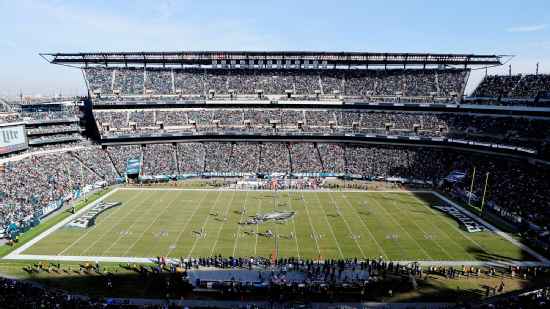
Atlanta Falcons @ Philadelphia Eagles
NFC DIVISIONAL PLAYOFF

10-6, 5-3 Away
10
10-6, 5-3 Away

13-3, 7-1 Home
15
13-3, 7-1 Home
Game Leaders


210
M. RyanQB
22/36, 1 TD
210

246
N. FolesQB
23/30
246

79
T. ColemanRB
10 CAR
79
54
J. AjayiRB
15 CAR
54

101
J. JonesWR
9 REC
101
61
A. JefferyWR
4 REC
61

1
T. McKinleyDE
1

1
F. CoxDT
1

8
R. AlfordCB
7 SOLO
8

8
M. JenkinsS
6 SOLO
8
Team Stats


281
Total Yards
334
0
Turnovers
2
19
1st Downs
22
4-73
Penalties
4-24
4/13
3rd Down
6/13
1/2
4th Down
1/1
1/3
Red Zone
1/3
27:54
Possession
32:06
Game Information
Philadelphia, PA
Side Judge:Allen Baynes
Down Judge:Ed Camp
Referee:Bill Vinovich
Field Judge:Tom Hill
Line Judge:Byron Boston
Umpire:Mark Pellis
Side Judge:Shawn Hochuli
Team Stats
 | | |
|---|---|---|
| 1st Downs | 19 | 22 |
| Passing 1st downs | 11 | 12 |
| Rushing 1st downs | 6 | 8 |
| 1st downs from penalties | 2 | 2 |
| 3rd down efficiency | 4-13 | 6-13 |
| 4th down efficiency | 1-2 | 1-1 |
| Total Plays | 59 | 63 |
| Total Yards | 281 | 334 |
| Total Drives | 9 | 9 |
| Yards per Play | 4.8 | 5.3 |
| Passing | 195 | 238 |
| Comp/Att | 22/36 | 23/30 |
| Yards per pass | 5.0 | 7.7 |
| Interceptions thrown | 0 | 0 |
| Sacks-Yards Lost | 3-15 | 1-8 |
| Rushing | 86 | 96 |
| Rushing Attempts | 20 | 32 |
| Yards per rush | 4.3 | 3.0 |
| Red Zone (Made-Att) | 1-3 | 1-3 |
| Penalties | 4-73 | 4-24 |
| Turnovers | 0 | 2 |
| Fumbles lost | 0 | 2 |
| Interceptions thrown | 0 | 0 |
| Defensive / Special Teams TDs | 0 | 0 |
| Possession | 27:54 | 32:06 |
2025 Standings
National Football Conference
| NFC South | W | L | T | PCT | PF | PA |
|---|---|---|---|---|---|---|
| Carolina | 8 | 9 | 0 | .471 | 311 | 380 |
| Tampa Bay | 8 | 9 | 0 | .471 | 380 | 411 |
| Atlanta | 8 | 9 | 0 | .471 | 353 | 401 |
| New Orleans | 6 | 11 | 0 | .353 | 306 | 383 |
| NFC East | W | L | T | PCT | PF | PA |
|---|---|---|---|---|---|---|
| Philadelphia | 11 | 6 | 0 | .647 | 379 | 325 |
| Dallas | 7 | 9 | 1 | .441 | 471 | 511 |
| Washington | 5 | 12 | 0 | .294 | 356 | 451 |
| New York | 4 | 13 | 0 | .235 | 381 | 439 |
NFL News

GM Ballard: There's 'scenario' where Richardson stays with Colts
Colts general manager Chris Ballard on Monday declined to rule out the possibility of quarterback Anthony Richardson Sr. remaining with the Colts in 2026.
1h
Jaguars to balance Travis Hunter's daily reps in OTAs
Whenever Jacksonville Jaguars cornerback Travis Hunter is cleared to return to the practice field this spring, he will be spending more time each day taking reps on both sides of the ball.
1h
Vikings to exercise fifth-year option on Jordan Addison's deal
The Vikings will exercise the fifth-year option on receiver Jordan Addison's contract, interim general manager Rob Brzezinski said Monday.
2h