
South Florida Bulls @ Louisville Cardinals

6-3, 2-2 Away
24
6-3, 2-2 Away
Final/OT
| 1 | 2 | 3 | 4 | OT | T | |
|---|---|---|---|---|---|---|
USF | 0 | 10 | 3 | 8 | 3 | 24 |
LOU | 7 | 7 | 0 | 7 | 0 | 21 |

5-5, 3-3 Home
21
5-5, 3-3 Home
Game Leaders


87
B.J. DanielsQB
11/19, 1 TD
87
146
J. BurkeQB
16/30, 3 TD, 1 INT
146
106
D. MurrayRB
13 CAR
106
140
B. PowellRB
31 CAR
140
52
D. BoganWR
3 REC, 1 TD
52
58
J. BellamyWR
5 REC, 1 TD
58
--
--
1
D. AshleyCB
1
7
S. JosephLB
6 SOLO
7
11
B. HeathLB
9 SOLO
11
Team Stats


259
Total Yards
328
1
Turnovers
2
10
1st Downs
20
5-55
Penalties
8-63
2/14
3rd Down
8/18
0/0
4th Down
1/2
16:48
Possession
19:35
Game Information
Louisville, KY
Team Stats
 | | |
|---|---|---|
| 1st Downs | 10 | 20 |
| 3rd down efficiency | 2-14 | 8-18 |
| 4th down efficiency | 0-0 | 1-2 |
| Total Yards | 259 | 328 |
| Passing | 101 | 146 |
| Comp/Att | 11/19 | 16/31 |
| Yards per pass | 4.6 | 4.7 |
| Interceptions thrown | 0 | 2 |
| Rushing | 172 | 182 |
| Rushing Attempts | 39 | 49 |
| Yards per rush | 4.4 | 3.7 |
| Penalties | 5-55 | 8-63 |
| Turnovers | 1 | 2 |
| Fumbles lost | 1 | 0 |
| Interceptions thrown | 0 | 2 |
| Possession | 16:48 | 19:35 |
2025 Standings
FBS
| American Conference | CONF | OVR |
|---|---|---|
| Tulane | 7-1 | 11-3 |
| North Texas | 7-1 | 12-2 |
| Navy | 7-1 | 11-2 |
| East Carolina | 6-2 | 9-4 |
| South Florida | 6-2 | 9-4 |
| Army | 4-4 | 7-6 |
| Memphis | 4-4 | 8-5 |
| UTSA | 4-4 | 7-6 |
| Temple | 3-5 | 5-7 |
| Florida Atlantic | 3-5 | 4-8 |
| Rice | 2-6 | 5-8 |
| UAB | 2-6 | 4-8 |
| Tulsa | 1-7 | 4-8 |
| Charlotte | 0-8 | 1-11 |
| Atlantic Coast Conference | CONF | OVR |
|---|---|---|
| Virginia | 7-1 | 11-3 |
| SMU | 6-2 | 9-4 |
| Miami | 6-2 | 13-3 |
| Pittsburgh | 6-2 | 8-5 |
| Georgia Tech | 6-2 | 9-4 |
| Duke | 6-2 | 9-5 |
| NC State | 4-4 | 8-5 |
| California | 4-4 | 7-6 |
| Clemson | 4-4 | 7-6 |
| Louisville | 4-4 | 9-4 |
| Wake Forest | 4-4 | 9-4 |
| Stanford | 3-5 | 4-8 |
| Florida State | 2-6 | 5-7 |
| North Carolina | 2-6 | 4-8 |
| Virginia Tech | 2-6 | 3-9 |
| Boston College | 1-7 | 2-10 |
| Syracuse | 1-7 | 3-9 |
NCAAF News
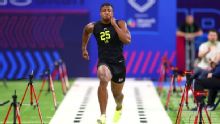
2026 NFL combine: Top draft prospects, best workouts, risers
Top prospects such as David Bailey and Ohio State's linebacker duo starred. Here are our experts on the combine's top workouts.
5h
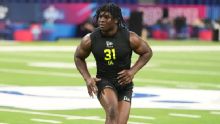
2026 NFL combine: Sonny Styles, Lee Hunter lead best photos
The NFL combine puts top prospects in front of countless cameras, and because they're sprinting full speed or lifting heavy weights, the result is often some hilariously intense facial expressions.
5h

Sources: Trump, college leaders to tackle issues at roundtable
Conference commissioners are expected to join sports celebrities and dignitaries on March 6 in a roundtable discussion with President Donald Trump about the future of college athletics, sources said.
3h