
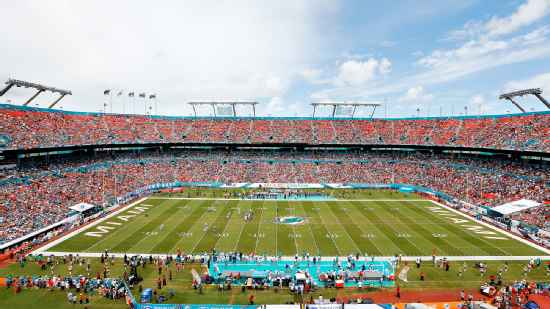
New York Giants @ Miami Dolphins

1-4, 1-2 Away
16
1-4, 1-2 Away

4-1, 2-0 Home
31
4-1, 2-0 Home
Game Leaders


Team Stats


268
Total Yards
524
0
Turnovers
3
15
1st Downs
22
6-43
Penalties
6-43
5/17
3rd Down
3/8
1/2
4th Down
0/0
0/2
Red Zone
2/3
35:59
Possession
24:01
Game Information
Miami Gardens, FL
Umpire:Barry Anderson
Referee:Ronald Torbert
Side Judge:Keith Washington
Down Judge:Max Causey
Line Judge:Maia Chaka
Field Judge:Ryan Dickson
Back Judge:Tony Josselyn
1st Quarter
Touchdown
7:09 - 1st
0
NYG
7
MIA
Jaylen Waddle 2 Yd pass from Tua Tagovailoa (Jason Sanders Kick)
8 plays, 89 yards, 4:18
2nd Quarter
Touchdown
10:02 - 2nd
0
NYG
14
MIA
De'Von Achane 76 Yd Run (Jason Sanders Kick)
3 plays, 94 yards, 0:58
Field Goal
3:41 - 2nd
3
NYG
14
MIA
Graham Gano 49 Yd Field Goal
13 plays, 44 yards, 6:21
Touchdown
1:40 - 2nd
10
NYG
14
MIA
Jason Pinnock 102 Yd Interception Return (Graham Gano Kick)
5 plays, 71 yards, 2:01
Field Goal
0:00 - 2nd
10
NYG
17
MIA
Jason Sanders 40 Yd Field Goal
9 plays, 50 yards, 1:40
3rd Quarter
Touchdown
14:06 - 3rd
10
NYG
24
MIA
Tyreek Hill 69 Yd pass from Tua Tagovailoa (Jason Sanders Kick)
3 plays, 75 yards, 0:54
Field Goal
4:26 - 3rd
13
NYG
24
MIA
Graham Gano 37 Yd Field Goal
4 plays, 4 yards, 2:18
Touchdown
0:00 - 3rd
13
NYG
31
MIA
Raheem Mostert 2 Yd Run (Jason Sanders Kick)
8 plays, 75 yards, 4:26
4th Quarter
Field Goal
8:51 - 4th
16
NYG
31
MIA
Graham Gano 51 Yd Field Goal
10 plays, 18 yards, 3:54
Data is currently unavailable.
Win Probability

0%
--NYG
100%
--MIA
According to ESPN Analytics
2025 Standings
National Football Conference
| NFC East | W | L | T | PCT | PF | PA |
|---|---|---|---|---|---|---|
| Philadelphia | 11 | 6 | 0 | .647 | 379 | 325 |
| Dallas | 7 | 9 | 1 | .441 | 471 | 511 |
| Washington | 5 | 12 | 0 | .294 | 356 | 451 |
| New York | 4 | 13 | 0 | .235 | 381 | 439 |
American Football Conference
| AFC East | W | L | T | PCT | PF | PA |
|---|---|---|---|---|---|---|
| New England | 14 | 3 | 0 | .824 | 490 | 320 |
| Buffalo | 12 | 5 | 0 | .706 | 481 | 365 |
| Miami | 7 | 10 | 0 | .412 | 347 | 424 |
| New York | 3 | 14 | 0 | .176 | 300 | 503 |
NFL News

Taylor Swift attends Tight End University with Travis Kelce
While eyes were on the couple amid their upcoming wedding, the singer/songwriter attended the exclusive event for tight ends.
9h
Wetzel: NFL's denial of Brendan Sorsby sends the right message
The NFL sent a powerful reminder to Sorsby and others: Sports wagering can bring significant repercussions.
11h

Bills great Jim Kelly says he recently had stroke but feels 'good'
Jim Kelly said he suffered a stroke this spring and subsequently spent a few days in the hospital, but added that he currently feels "really good."
11h