
Dallas Cowboys @ Arizona Cardinals

4-2, 2-1 Away
24
4-2, 2-1 Away

4-2, 3-0 Home
30
4-2, 3-0 Home
Game Leaders


Team Stats


374
Total Yards
276
1
Turnovers
3
15
1st Downs
14
12-93
Penalties
12-70
6/15
3rd Down
5/12
0/0
4th Down
0/0
1/2
Red Zone
2/3
33:15
Possession
27:45
Game Information
Glendale, AZ
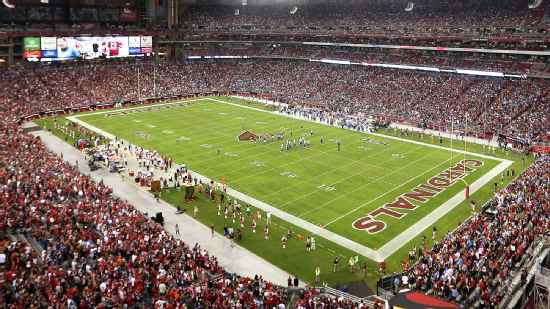
Referee:Pete Morelli
Team Stats
 | | |
|---|---|---|
| 1st Downs | 15 | 14 |
| Passing 1st downs | 11 | 11 |
| Rushing 1st downs | 4 | 3 |
| 1st downs from penalties | 0 | 0 |
| 3rd down efficiency | 6-15 | 5-12 |
| 4th down efficiency | 0-0 | 0-0 |
| Total Plays | 63 | 50 |
| Total Yards | 374 | 276 |
| Total Drives | 14 | 15 |
| Yards per Play | 5.9 | 5.5 |
| Passing | 301 | 226 |
| Comp/Att | 24/38 | 22/30 |
| Yards per pass | 7.3 | 7.3 |
| Interceptions thrown | 0 | 1 |
| Sacks-Yards Lost | 3-20 | 1-10 |
| Rushing | 73 | 50 |
| Rushing Attempts | 22 | 19 |
| Yards per rush | 3.3 | 2.6 |
| Red Zone (Made-Att) | 1-2 | 2-3 |
| Penalties | 12-93 | 12-70 |
| Turnovers | 1 | 3 |
| Fumbles lost | 1 | 2 |
| Interceptions thrown | 0 | 1 |
| Defensive / Special Teams TDs | 0 | 2 |
| Possession | 33:15 | 27:45 |
2025 Standings
National Football Conference
| NFC East | W | L | T | PCT | PF | PA |
|---|---|---|---|---|---|---|
| Philadelphia | 11 | 6 | 0 | .647 | 379 | 325 |
| Dallas | 7 | 9 | 1 | .441 | 471 | 511 |
| Washington | 5 | 12 | 0 | .294 | 356 | 451 |
| New York | 4 | 13 | 0 | .235 | 381 | 439 |
| NFC West | W | L | T | PCT | PF | PA |
|---|---|---|---|---|---|---|
| Seattle | 14 | 3 | 0 | .824 | 483 | 292 |
| Los Angeles | 12 | 5 | 0 | .706 | 518 | 346 |
| San Francisco | 12 | 5 | 0 | .706 | 437 | 371 |
| Arizona | 3 | 14 | 0 | .176 | 355 | 488 |
NFL News

2026 Fantasy Football Draft Guide: Rankings, mock drafts and analysis
Your one-stop shop as you prep for draft season, including rankings, projections and analysis.
5h

Late Cowboys player Marshawn Kneeland diagnosed with CTE
Former Cowboys defensive end Marshawn Kneeland has been posthumously diagnosed with CTE.
5h
Fantasy team tiers: Which NFL squad has the most fantasy value?
Eric Karabell places NFL teams in tiers for fantasy value this season. Which teams should you want a piece of?
5h