
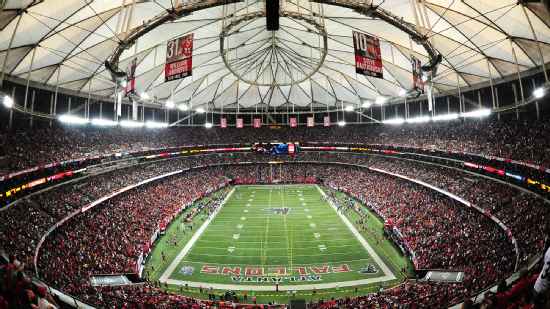
Miami Dolphins @ Atlanta Falcons

0-1, 0-1 Away
7
0-1, 0-1 Away

1-0, 1-0 Home
19
1-0, 1-0 Home
Game Leaders


Team Stats


259
Total Yards
281
4
Turnovers
0
16
1st Downs
19
4-27
Penalties
4-35
4/11
3rd Down
6/15
1/1
4th Down
0/0
1/2
Red Zone
2/5
29:07
Possession
30:53
Game Information
Atlanta, GA
Referee:Walt Coleman
Team Stats
 | | |
|---|---|---|
| 1st Downs | 16 | 19 |
| Passing 1st downs | 11 | 15 |
| Rushing 1st downs | 4 | 3 |
| 1st downs from penalties | 1 | 1 |
| 3rd down efficiency | 4-11 | 6-15 |
| 4th down efficiency | 1-1 | 0-0 |
| Total Plays | 56 | 65 |
| Total Yards | 259 | 281 |
| Total Drives | 11 | 11 |
| Yards per Play | 4.6 | 4.3 |
| Passing | 163 | 213 |
| Comp/Att | 21/30 | 22/36 |
| Yards per pass | 4.8 | 5.6 |
| Interceptions thrown | 1 | 0 |
| Sacks-Yards Lost | 4-13 | 2-16 |
| Rushing | 96 | 68 |
| Rushing Attempts | 22 | 27 |
| Yards per rush | 4.4 | 2.5 |
| Red Zone (Made-Att) | 1-2 | 2-5 |
| Penalties | 4-27 | 4-35 |
| Turnovers | 4 | 0 |
| Fumbles lost | 3 | 0 |
| Interceptions thrown | 1 | 0 |
| Defensive / Special Teams TDs | 0 | 0 |
| Possession | 29:07 | 30:53 |
2025 Standings
American Football Conference
| AFC East | W | L | T | PCT | PF | PA |
|---|---|---|---|---|---|---|
| New England | 14 | 3 | 0 | .824 | 490 | 320 |
| Buffalo | 12 | 5 | 0 | .706 | 481 | 365 |
| Miami | 7 | 10 | 0 | .412 | 347 | 424 |
| New York | 3 | 14 | 0 | .176 | 300 | 503 |
National Football Conference
| NFC South | W | L | T | PCT | PF | PA |
|---|---|---|---|---|---|---|
| Carolina | 8 | 9 | 0 | .471 | 311 | 380 |
| Tampa Bay | 8 | 9 | 0 | .471 | 380 | 411 |
| Atlanta | 8 | 9 | 0 | .471 | 353 | 401 |
| New Orleans | 6 | 11 | 0 | .353 | 306 | 383 |
NFL News

Is Mike Evans worth the risk in fantasy?
Is Mike Evans worth the risk in fantasy?
6h

Fantasy football 2026 defensive depth charts
Your guide to each NFL team's most valuable fantasy defensive players for the 2026 season.
10h

Fantasy football 2026 offensive depth charts
Your guide to each NFL team's most valuable offensive players from a fantasy standpoint for the 2026 season.
10h