
Dallas Cowboys @ San Francisco 49ers

1-1, 1-1 Away
27
1-1, 1-1 Away

1-1, 1-1 Home
24
1-1, 1-1 Home
Game Leaders


Team Stats


472
Total Yards
206
2
Turnovers
1
20
1st Downs
14
8-83
Penalties
5-25
6/14
3rd Down
8/16
1/1
4th Down
0/0
1/3
Red Zone
2/2
32:10
Possession
30:43
Game Information
San Francisco, CA

Referee:Ron Winter
Team Stats
 | | |
|---|---|---|
| 1st Downs | 20 | 14 |
| Passing 1st downs | 17 | 10 |
| Rushing 1st downs | 3 | 3 |
| 1st downs from penalties | 0 | 1 |
| 3rd down efficiency | 6-14 | 8-16 |
| 4th down efficiency | 1-1 | 0-0 |
| Total Plays | 66 | 54 |
| Total Yards | 472 | 206 |
| Total Drives | 12 | 12 |
| Yards per Play | 7.2 | 3.8 |
| Passing | 427 | 132 |
| Comp/Att | 26/43 | 16/24 |
| Yards per pass | 9.7 | 4.4 |
| Interceptions thrown | 2 | 1 |
| Sacks-Yards Lost | 1-5 | 6-47 |
| Rushing | 45 | 74 |
| Rushing Attempts | 22 | 24 |
| Yards per rush | 2.0 | 3.1 |
| Red Zone (Made-Att) | 1-3 | 2-2 |
| Penalties | 8-83 | 5-25 |
| Turnovers | 2 | 1 |
| Fumbles lost | 0 | 0 |
| Interceptions thrown | 2 | 1 |
| Defensive / Special Teams TDs | 0 | 0 |
| Possession | 32:10 | 30:43 |
2025 Standings
National Football Conference
| NFC East | W | L | T | PCT | PF | PA |
|---|---|---|---|---|---|---|
| Philadelphia | 11 | 6 | 0 | .647 | 379 | 325 |
| Dallas | 7 | 9 | 1 | .441 | 471 | 511 |
| Washington | 5 | 12 | 0 | .294 | 356 | 451 |
| New York | 4 | 13 | 0 | .235 | 381 | 439 |
| NFC West | W | L | T | PCT | PF | PA |
|---|---|---|---|---|---|---|
| Seattle | 14 | 3 | 0 | .824 | 483 | 292 |
| Los Angeles | 12 | 5 | 0 | .706 | 518 | 346 |
| San Francisco | 12 | 5 | 0 | .706 | 437 | 371 |
| Arizona | 3 | 14 | 0 | .176 | 355 | 488 |
NFL News

Why Riddick has lower expectations for Lamar this season
Why Riddick has lower expectations for Lamar this season
9m
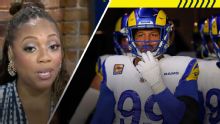
Kimberley A. Martin 'all-in' on Rams to the Super Bowl if Aaron Donald returns
Kimberley A. Martin 'all-in' on Rams to the Super Bowl if Aaron Donald returns
34m

Is this George Pickens' last season with the Cowboys?
Is this George Pickens' last season with the Cowboys?
1h