
Philadelphia Eagles @ Seattle Seahawks

4-8, 3-3 Away
14
4-8, 3-3 Away

5-7, 3-3 Home
31
5-7, 3-3 Home
Game Leaders


Team Stats


330
Total Yards
347
4
Turnovers
0
20
1st Downs
15
5-28
Penalties
5-30
2/8
3rd Down
5/12
1/1
4th Down
1/1
2/2
Red Zone
2/3
29:40
Possession
30:20
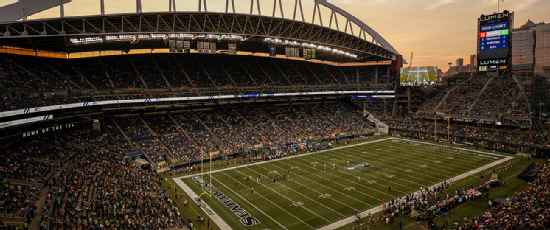
Game Information
Seattle, WA
Referee:Pete Morelli
Team Stats
 | | |
|---|---|---|
| 1st Downs | 20 | 15 |
| Passing 1st downs | 10 | 8 |
| Rushing 1st downs | 10 | 6 |
| 1st downs from penalties | 0 | 1 |
| 3rd down efficiency | 2-8 | 5-12 |
| 4th down efficiency | 1-1 | 1-1 |
| Total Plays | 56 | 52 |
| Total Yards | 330 | 347 |
| Total Drives | 11 | 10 |
| Yards per Play | 5.9 | 6.7 |
| Passing | 198 | 173 |
| Comp/Att | 17/29 | 13/16 |
| Yards per pass | 6.4 | 9.1 |
| Interceptions thrown | 4 | 0 |
| Sacks-Yards Lost | 2-10 | 3-17 |
| Rushing | 132 | 174 |
| Rushing Attempts | 25 | 33 |
| Yards per rush | 5.3 | 5.3 |
| Red Zone (Made-Att) | 2-2 | 2-3 |
| Penalties | 5-28 | 5-30 |
| Turnovers | 4 | 0 |
| Fumbles lost | 0 | 0 |
| Interceptions thrown | 4 | 0 |
| Defensive / Special Teams TDs | 0 | 2 |
| Possession | 29:40 | 30:20 |
2025 Standings
National Football Conference
| NFC East | W | L | T | PCT | PF | PA |
|---|---|---|---|---|---|---|
| Philadelphia | 11 | 6 | 0 | .647 | 379 | 325 |
| Dallas | 7 | 9 | 1 | .441 | 471 | 511 |
| Washington | 5 | 12 | 0 | .294 | 356 | 451 |
| New York | 4 | 13 | 0 | .235 | 381 | 439 |
| NFC West | W | L | T | PCT | PF | PA |
|---|---|---|---|---|---|---|
| Seattle | 14 | 3 | 0 | .824 | 483 | 292 |
| Los Angeles | 12 | 5 | 0 | .706 | 518 | 346 |
| San Francisco | 12 | 5 | 0 | .706 | 437 | 371 |
| Arizona | 3 | 14 | 0 | .176 | 355 | 488 |
NFL News

Field Yates' fantasy football PPR rankings: Top 160 for 2026
Field provides his latest rankings for the upcoming season, which will be updated throughout the offseason.
8m
Eric Karabell's 2026 fantasy football flex and superflex rankings
A look at the top 200 QBs, RBs, WRs and TEs for 2026 drafts, updated throughout the fantasy football offseason.
1h

Fantasy football buzz: Don't sleep on 49ers' Pearsall late in drafts
Ricky Pearsall has yet to play a full season, but he offers breakout potential in Year 3 and can be had late in drafts.
25m