
New York Giants @ New England Patriots
Super Bowl XLVI

9-7, 5-3 Away
21
9-7, 5-3 Away

13-3, 7-1 Home
17
13-3, 7-1 Home
Game Leaders


Team Stats


396
Total Yards
349
0
Turnovers
1
26
1st Downs
21
4-24
Penalties
5-28
5/11
3rd Down
6/12
0/0
4th Down
1/1
2/3
Red Zone
2/3
37:05
Possession
22:55
Game Information
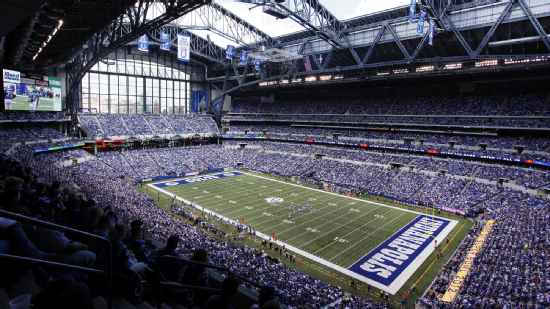
Indianapolis, IN
Team Stats
 | | |
|---|---|---|
| 1st Downs | 26 | 21 |
| Passing 1st downs | 18 | 15 |
| Rushing 1st downs | 7 | 6 |
| 1st downs from penalties | 1 | 0 |
| 3rd down efficiency | 5-11 | 6-12 |
| 4th down efficiency | 0-0 | 1-1 |
| Total Plays | 71 | 62 |
| Total Yards | 396 | 349 |
| Total Drives | 9 | 9 |
| Yards per Play | 5.6 | 5.6 |
| Passing | 282 | 266 |
| Comp/Att | 30/40 | 27/41 |
| Yards per pass | 6.6 | 6.2 |
| Interceptions thrown | 0 | 1 |
| Sacks-Yards Lost | 3-14 | 2-10 |
| Rushing | 114 | 83 |
| Rushing Attempts | 28 | 19 |
| Yards per rush | 4.1 | 4.4 |
| Red Zone (Made-Att) | 2-3 | 2-3 |
| Penalties | 4-24 | 5-28 |
| Turnovers | 0 | 1 |
| Fumbles lost | 0 | 0 |
| Interceptions thrown | 0 | 1 |
| Defensive / Special Teams TDs | 0 | 0 |
| Possession | 37:05 | 22:55 |
2025 Standings
National Football Conference
| NFC East | W | L | T | PCT | PF | PA |
|---|---|---|---|---|---|---|
| Philadelphia | 11 | 6 | 0 | .647 | 379 | 325 |
| Dallas | 7 | 9 | 1 | .441 | 471 | 511 |
| Washington | 5 | 12 | 0 | .294 | 356 | 451 |
| New York | 4 | 13 | 0 | .235 | 381 | 439 |
American Football Conference
| AFC East | W | L | T | PCT | PF | PA |
|---|---|---|---|---|---|---|
| New England | 14 | 3 | 0 | .824 | 490 | 320 |
| Buffalo | 12 | 5 | 0 | .706 | 481 | 365 |
| Miami | 7 | 10 | 0 | .412 | 347 | 424 |
| New York | 3 | 14 | 0 | .176 | 300 | 503 |
NFL News

NFL players continue push for grass fields on heels of World Cup
Dozens of NFL players are continuing their push for the installment of permanent grass playing surfaces across the league after it was used successfully for World Cup matches at 11 league stadiums.
4h

Ethan Pocic signing 1-year deal with Ravens, sources say
Former Cleveland Browns center Ethan Pocic is signing a one-year deal with the Baltimore Ravens, sources told ESPN's Adam Schefter.
5h

Titans to induct former RB Chris Johnson in ring of honor
The Titans are going to induct former running back Chris Johnson into their ring of honor.
11h