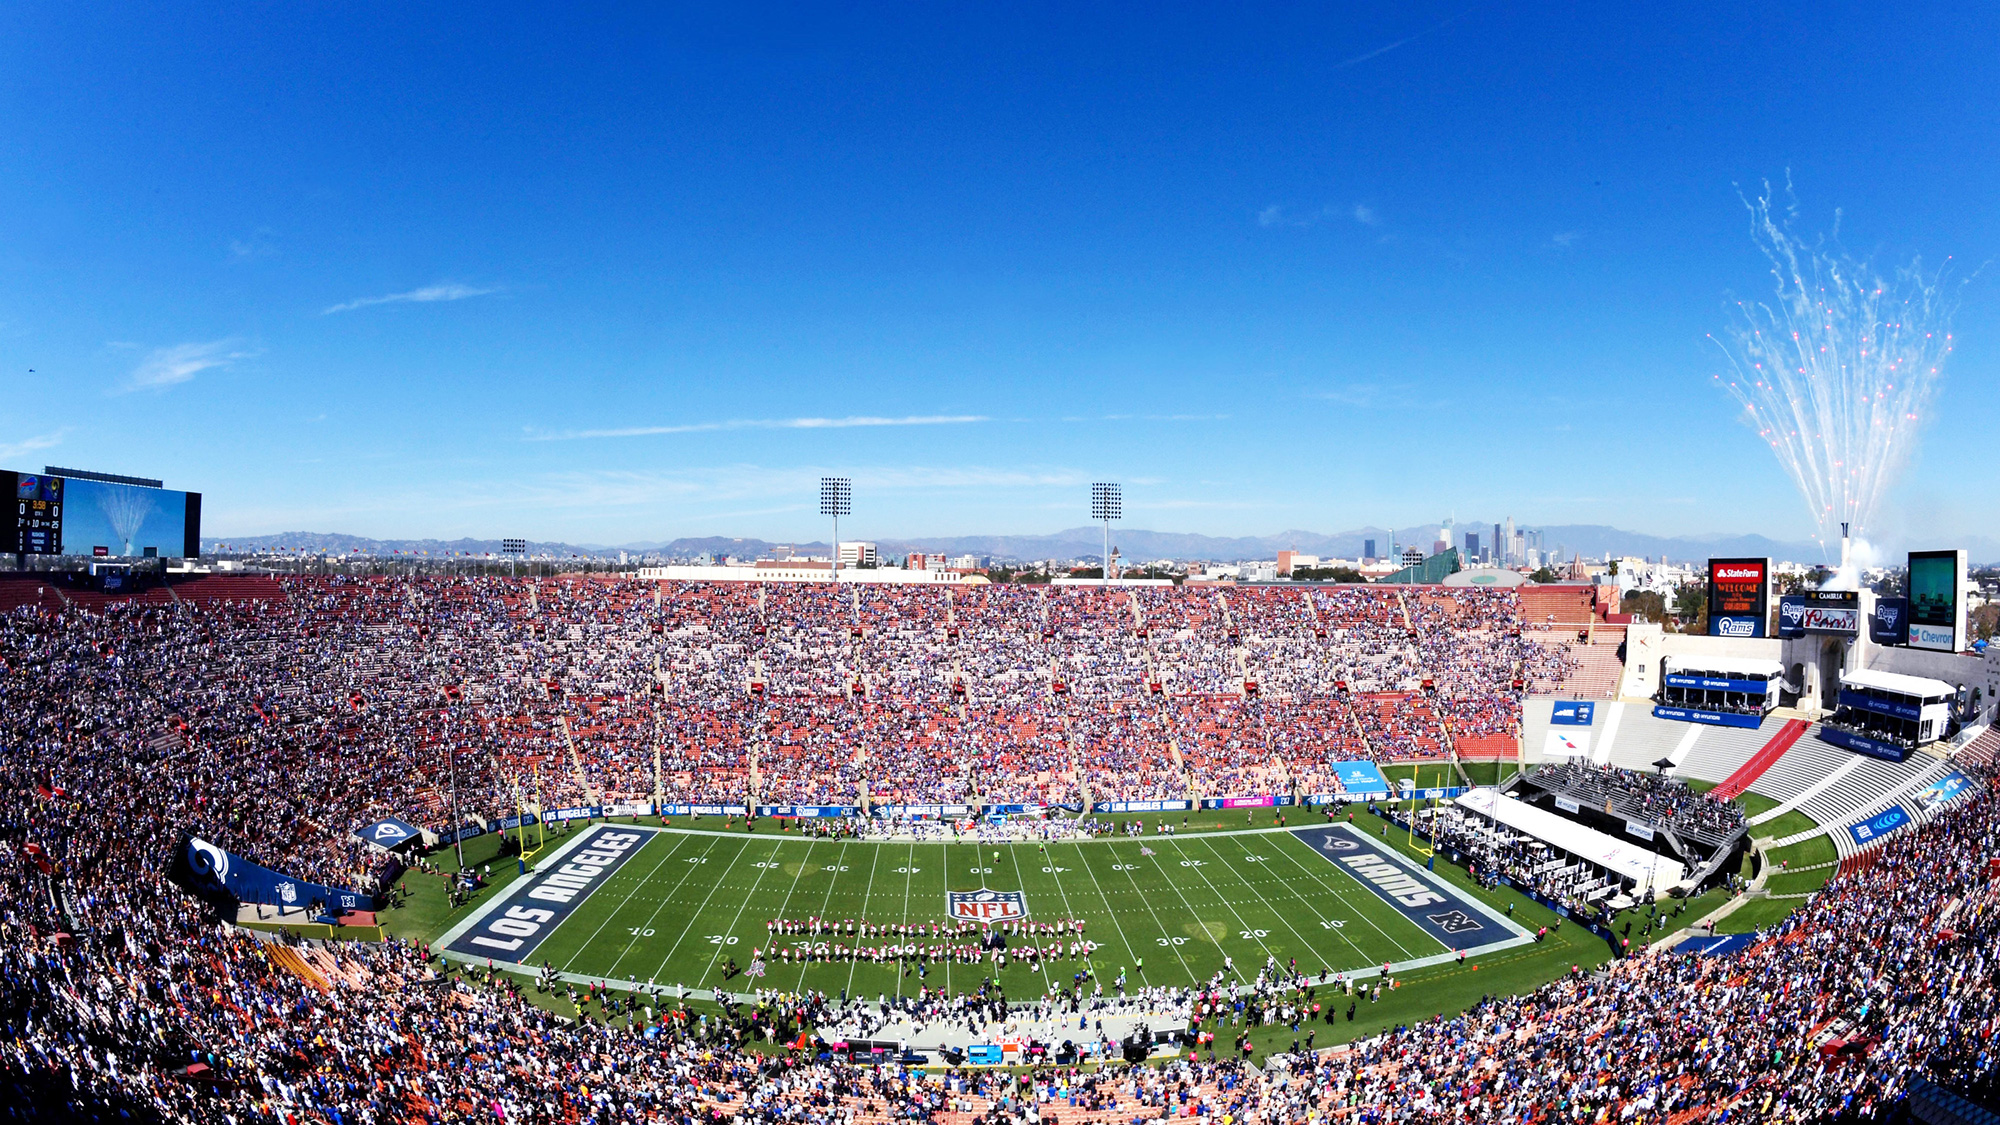
Kansas City Chiefs @ Los Angeles Rams
Game Leaders
Team Stats
546
Total Yards
455
5
Turnovers
2
27
1st Downs
29
13-135
Penalties
8-60
5/10
3rd Down
5/14
1/1
4th Down
1/1
3/4
Red Zone
4/6
29:37
Possession
30:23
Game Information
Los Angeles, CA


Team Stats
| 1st Downs | 27 | 29 |
| Passing 1st downs | 21 | 21 |
| Rushing 1st downs | 2 | 4 |
| 1st downs from penalties | 4 | 4 |
| 3rd down efficiency | 5-10 | 5-14 |
| 4th down efficiency | 1-1 | 1-1 |
| Total Plays | 69 | 75 |
| Total Yards | 546 | 455 |
| Total Drives | 15 | 15 |
| Yards per Play | 7.9 | 6.1 |
| Passing | 448 | 379 |
| Comp/Att | 33/46 | 31/49 |
| Yards per pass | 9.1 | 7.0 |
| Interceptions thrown | 3 | 0 |
| Sacks-Yards Lost | 3-30 | 5-34 |
| Rushing | 98 | 76 |
| Rushing Attempts | 20 | 21 |
| Yards per rush | 4.9 | 3.6 |
| Red Zone (Made-Att) | 3-4 | 4-6 |
| Penalties | 13-135 | 8-60 |
| Turnovers | 5 | 2 |
| Fumbles lost | 2 | 2 |
| Interceptions thrown | 3 | 0 |
| Defensive / Special Teams TDs | 1 | 2 |
| Possession | 29:37 | 30:23 |
2025 Standings
American Football Conference
| AFC West | W | L | T | PCT | PF | PA |
|---|---|---|---|---|---|---|
| Denver | 14 | 3 | 0 | .824 | 401 | 311 |
| Los Angeles | 11 | 6 | 0 | .647 | 368 | 340 |
| Kansas City | 6 | 11 | 0 | .353 | 362 | 328 |
| Las Vegas | 3 | 14 | 0 | .176 | 241 | 432 |
National Football Conference
| NFC West | W | L | T | PCT | PF | PA |
|---|---|---|---|---|---|---|
| Seattle | 14 | 3 | 0 | .824 | 483 | 292 |
| Los Angeles | 12 | 5 | 0 | .706 | 518 | 346 |
| San Francisco | 12 | 5 | 0 | .706 | 437 | 371 |
| Arizona | 3 | 14 | 0 | .176 | 355 | 488 |
NFL News

Klint Kubiak 'fired up' about taking Raiders' coaching job
Seahawks OC Klint Kubiak confirmed on NFL Network following the team's Super Bowl win over the Patriots on Sunday night that he will be leaving Seattle to take over as coach of the Raiders.
7m

Seahawks-Patriots Super Bowl history: Records, stats, facts
The Seattle Seahawks beat the New England Patriots 29-13 in Super Bowl LX. Check out how the two teams stacked up against the other.
12m

Michael Dickson on winning SBLX: 'It means everything'
Michael Dickson shares the surreal feeling of becoming a Super Bowl champion after his Seattle Seahawks blew out the New England Patriots in SBLX.
9m
GAMBLING PROBLEM? CALL 1-800-GAMBLER, (800) 327-5050 or visit gamblinghelplinema.org (MA). Call 877-8-HOPENY/text HOPENY (467369) (NY). Please Gamble Responsibly. 888-789-7777/visit ccpg.org (CT), or visit www.mdgamblinghelp.org (MD). 21+ and present in most states. (18+ DC/KY/NH/WY). Void in ONT/OR/NH. Eligibility restrictions apply. On behalf of Boot Hill Casino & Resort (KS). Terms: sportsbook.draftkings.com/promos.
Copyright: © 2026 ESPN Enterprises, Inc. All rights reserved.


