


Game Information
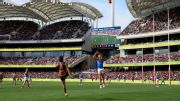
Adelaide Oval
| fourth Quarter | |||
|---|---|---|---|
| Time | Team | Play | Score |
| 23:48 |  | J. Dunkley Goal | 86 - 69 |
| 14:36 | | A. Naughton Behind | 86 - 63 |
| 12:38 |  | M. Georgiades Behind | 86 - 62 |
| 11:01 | | O. Wines Behind | 85 - 62 |
| 7:26 | | S. Motlop Behind | 84 - 62 |
| 5:54 | | T. Boak Behind | 83 - 62 |
| 5:06 | | Rushed | 82 - 62 |
| 3:10 | | B. Smith Goal | 81 - 62 |
| 1:33 | | J. Finlayson Behind | 81 - 56 |
| third Quarter | |||
| Time | Team | Play | Score |
| 30:45 | | A. Naughton Goal | 80 - 56 |
| 29:06 | | J. Finlayson Goal | 80 - 50 |
| 23:10 | | L. McNeil Behind | 74 - 50 |
| 21:37 | | T. Marshall Goal | 74 - 49 |
| 20:17 | | T. Marshall Behind | 68 - 49 |
| 16:27 | | T. Dumont Goal | 67 - 49 |
| 15:21 | | R. Gray Behind | 61 - 49 |
| 14:12 | | M. Georgiades Behind | 60 - 49 |
| 13:41 | | B. Smith Behind | 59 - 49 |
| 11:44 | | M. Georgiades Behind | 59 - 48 |
| 10:00 | | T. Boak Goal | 58 - 48 |
| 3:16 | | A. Naughton Goal | 52 - 48 |
| 1:10 | | S. Powell-Pepper Goal | 52 - 42 |
| second Quarter | |||
| Time | Team | Play | Score |
| 28:17 | | R. McComb Behind | 46 - 42 |
| 22:52 | | S. Motlop Behind | 46 - 41 |
| 22:35 | | S. Powell-Pepper Behind | 45 - 41 |
| 16:04 | | T. Liberatore Goal | 44 - 41 |
| 13:01 | | R. Smith Behind | 44 - 35 |
| 9:19 | | M. Georgiades Behind | 44 - 34 |
| 7:32 | | J. Finlayson Goal | 43 - 34 |
| 5:44 | | Z. Butters Behind | 37 - 34 |
| 3:58 | | B. Khamis Goal | 36 - 34 |
| 2:09 | | T. Marshall Goal | 36 - 28 |
| first Quarter | |||
| Time | Team | Play | Score |
| 35:59 | | R. Gray Goal | 30 - 28 |
| 32:43 | | Rushed | 24 - 28 |
| 31:02 | | A. Naughton Goal | 24 - 27 |
| 28:45 | | A. Naughton Behind | 24 - 21 |
| 24:55 | | A. Naughton Goal | 24 - 20 |
| 23:38 | | S. Powell-Pepper Goal | 24 - 14 |
| 20:38 | | J. Finlayson Goal | 18 - 14 |
| 17:48 | | S. Motlop Goal | 12 - 14 |
| 14:50 | | R. Gray Goal | 6 - 14 |
| 12:49 | | J. Macrae Behind | 0 - 14 |
| 6:04 | | B. Smith Goal | 0 - 13 |
| 4:25 | | L. McNeil Goal | 0 - 7 |
| 1:29 | | B. Khamis Behind | 0 - 1 |
Adelaide icon Tony Modra has woken after facial surgery and remains in a serious, but stable, condition in hospital.
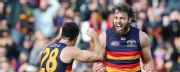
Two fourth quarter goals from Josh Rachele led Adelaide to a gutsy 17-point win over Melbourne.
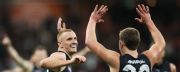
Nick Daicos and Jordan De Goey have fired Collingwood to a scrappy 27-point win over injury-hit Port Adelaide, who lost three players during a third quarter of carnage.
Carlton's charge to the AFL finals under interim coach Josh Fraser is right on course, with the Blues soaring to a 23-point victory to heap more misery on GWS.
Adelaide, the AFL's great escape artists, have come from behind to pip Melbourne by 17 points and climb to fifth on the ladder.
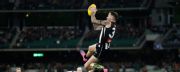
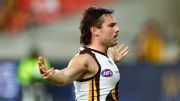
Nick Watson shows his dash, outrunning his opponents for his first goal of the match.
| POS | Team | Pts. | % | Form |
|---|---|---|---|---|
| 1 |
 FRE FRE
|
52 | 144.4 | WWWWW |
| 2 |
 SYD SYD
|
48 | 143.7 | WLWWW |
| 3 |
 HAW HAW
|
38 | 113.5 | LWWLW |
| 4 |
 GEEL GEEL
|
36 | 120.6 | WLLWL |
| 5 |
 ADEL ADEL
|
36 | 113.2 | WLWWW |
| 6 |
 MELB MELB
|
36 | 104.2 | LLWWL |
| 7 |
 BL BL
|
32 | 108.4 | LLLWW |
| 8 |
 WB WB
|
32 | 90.7 | LWWWL |
| 9 |
 SUNS SUNS
|
28 | 105.3 | WLLLL |
| 10 |
 NMFC NMFC
|
28 | 90.7 | LWLWW |
| 11 |
 COLL COLL
|
26 | 101.5 | LWLLW |
| 12 |
 STK STK
|
24 | 102.4 | WLLLW |
| 13 |
 GWS GWS
|
24 | 100.3 | LWWLL |
| 14 |
 CARL CARL
|
24 | 91.1 | WWWWW |
| 15 |
 PORT PORT
|
16 | 98.7 | LLWLL |
| 16 |
 WCE WCE
|
16 | 72.7 | WLWLL |
| 17 |
 RICH RICH
|
8 | 61.3 | LWLLL |
| 18 |
 ESS ESS
|
4 | 70.4 | LLLLL |