
Miami Hurricanes @ Temple Owls

4-0, 1-0 Away
41
4-0, 1-0 Away

2-2, 2-1 Home
7
2-2, 2-1 Home
Game Leaders


220
T. Van DykeQB
17/24, 3 TD
220

240
E.J. WarnerQB
22/39, 1 TD, 2 INT
240

139
H. Parrish Jr.RB
16 CAR, 2 TD
139
12
E. SaydeeRB
2 CAR
12

90
J. GeorgeWR
5 REC
90

117
A. Anderson Jr.WR
10 REC
117

2
T. GoreDL
2

--
--

5
J. DavisCB
5 SOLO
5

11
A. OdomDB
8 SOLO
11
Team Stats


543
Total Yards
279
0
Turnovers
3
24
1st Downs
13
7-65
Penalties
6-37
5/11
3rd Down
5/13
0/1
4th Down
0/3
32:34
Possession
27:26
Game Information
Philadelphia, PA

Team Stats
 | | |
|---|---|---|
| 1st Downs | 24 | 13 |
| 3rd down efficiency | 5-11 | 5-13 |
| 4th down efficiency | 0-1 | 0-3 |
| Total Yards | 543 | 279 |
| Passing | 220 | 268 |
| Comp/Att | 17/25 | 23/42 |
| Yards per pass | 8.8 | 6.4 |
| Interceptions thrown | 0 | 2 |
| Rushing | 323 | 11 |
| Rushing Attempts | 42 | 16 |
| Yards per rush | 7.7 | 0.7 |
| Penalties | 7-65 | 6-37 |
| Turnovers | 0 | 3 |
| Fumbles lost | 0 | 1 |
| Interceptions thrown | 0 | 2 |
| Possession | 32:34 | 27:26 |
MIA @ TEM Videos
Colbie Young hauls it in for 28-yard touchdown
Chris Johnson Jr. breaks off 24-yard run
Mark Fletcher Jr. breaks off 17-yard carry
2025 Standings
FBS
| Atlantic Coast Conference | CONF | OVR |
|---|---|---|
| Virginia | 7-1 | 11-3 |
| SMU | 6-2 | 9-4 |
| Miami | 6-2 | 13-3 |
| Pittsburgh | 6-2 | 8-5 |
| Georgia Tech | 6-2 | 9-4 |
| Duke | 6-2 | 9-5 |
| NC State | 4-4 | 8-5 |
| California | 4-4 | 7-6 |
| Clemson | 4-4 | 7-6 |
| Louisville | 4-4 | 9-4 |
| Wake Forest | 4-4 | 9-4 |
| Stanford | 3-5 | 4-8 |
| Florida State | 2-6 | 5-7 |
| North Carolina | 2-6 | 4-8 |
| Virginia Tech | 2-6 | 3-9 |
| Boston College | 1-7 | 2-10 |
| Syracuse | 1-7 | 3-9 |
| American Conference | CONF | OVR |
|---|---|---|
| Tulane | 7-1 | 11-3 |
| North Texas | 7-1 | 12-2 |
| Navy | 7-1 | 11-2 |
| East Carolina | 6-2 | 9-4 |
| South Florida | 6-2 | 9-4 |
| Army | 4-4 | 7-6 |
| Memphis | 4-4 | 8-5 |
| UTSA | 4-4 | 7-6 |
| Temple | 3-5 | 5-7 |
| Florida Atlantic | 3-5 | 4-8 |
| Rice | 2-6 | 5-8 |
| UAB | 2-6 | 4-8 |
| Tulsa | 1-7 | 4-8 |
| Charlotte | 0-8 | 1-11 |
NCAAF News
Colorado QB Dominiq Ponder dies in single-car crash at 23
Colorado quarterback Dominiq Ponder died early Sunday morning in a single-car crash, according to police. He was 23.
11h
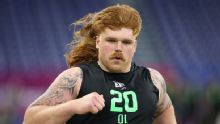
2026 NFL combine: Gennings Dunker, Alan Herron lead best photos
The NFL combine puts top prospects in front of countless cameras, and because they're sprinting full speed or lifting heavy weights, the result is often some hilariously intense facial expressions.
16h

2026 NFL combine: Top draft prospects, best workouts, risers
Spencer Fano impressed in the 40-yard dash, but there are plenty of strong offensive line prospects. Our experts break down the combine's top workouts.
16h