
Denver Broncos @ Philadelphia Eagles

3-5, 0-4 Away
23
3-5, 0-4 Away

8-1, 5-0 Home
51
8-1, 5-0 Home
Game Leaders


Team Stats


226
Total Yards
419
2
Turnovers
1
14
1st Downs
25
14-105
Penalties
5-35
3/13
3rd Down
5/13
1/1
4th Down
2/4
1/2
Red Zone
4/4
30:06
Possession
29:54
Game Information
Philadelphia, PA
Team Stats
 | | |
|---|---|---|
| 1st Downs | 14 | 25 |
| Passing 1st downs | 12 | 13 |
| Rushing 1st downs | 1 | 9 |
| 1st downs from penalties | 1 | 3 |
| 3rd down efficiency | 3-13 | 5-13 |
| 4th down efficiency | 1-1 | 2-4 |
| Total Plays | 60 | 67 |
| Total Yards | 226 | 419 |
| Total Drives | 12 | 14 |
| Yards per Play | 3.8 | 6.3 |
| Passing | 191 | 222 |
| Comp/Att | 19/38 | 16/28 |
| Yards per pass | 4.7 | 7.4 |
| Interceptions thrown | 2 | 0 |
| Sacks-Yards Lost | 3-17 | 2-12 |
| Rushing | 35 | 197 |
| Rushing Attempts | 19 | 37 |
| Yards per rush | 1.8 | 5.3 |
| Red Zone (Made-Att) | 1-2 | 4-4 |
| Penalties | 14-105 | 5-35 |
| Turnovers | 2 | 1 |
| Fumbles lost | 0 | 1 |
| Interceptions thrown | 2 | 0 |
| Defensive / Special Teams TDs | 2 | 0 |
| Possession | 30:06 | 29:54 |
2025 Standings
American Football Conference
| AFC West | W | L | T | PCT | PF | PA |
|---|---|---|---|---|---|---|
| Denver | 14 | 3 | 0 | .824 | 401 | 311 |
| Los Angeles | 11 | 6 | 0 | .647 | 368 | 340 |
| Kansas City | 6 | 11 | 0 | .353 | 362 | 328 |
| Las Vegas | 3 | 14 | 0 | .176 | 241 | 432 |
National Football Conference
| NFC East | W | L | T | PCT | PF | PA |
|---|---|---|---|---|---|---|
| Philadelphia | 11 | 6 | 0 | .647 | 379 | 325 |
| Dallas | 7 | 9 | 1 | .441 | 471 | 511 |
| Washington | 5 | 12 | 0 | .294 | 356 | 451 |
| New York | 4 | 13 | 0 | .235 | 381 | 439 |
NFL News
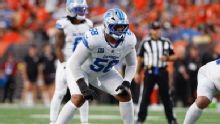
Execs, coaches, scouts rank top NFL offensive tackles for 2026
A new No. 1 OT in the league? Two blockers from the same team in the top 10? We canvassed NFL decision-makers to rank the NFL's best tackles for 2026.
5h

Did the Seahawks get better, worse or stay the same for 2026?
After some notable departures, let's look at key positions ahead of the 2026 season.
5h

How high should Cam Skattebo be drafted?
How high should Cam Skattebo be drafted?
14h