


Game Information
Adelaide Oval
| fourth Quarter | |||
|---|---|---|---|
| Time | Team | Play | Score |
| 33:27 |  | J. Finlayson Goal | 89 - 96 |
| 32:29 |  | B. Fritsch Behind | 83 - 96 |
| 29:07 | | B. Fritsch Goal | 83 - 95 |
| 22:08 | | B. Brown Goal | 83 - 89 |
| 17:36 | | C. Rozee Goal | 83 - 83 |
| 16:19 | | J. Finlayson Behind | 77 - 83 |
| 14:11 | | J. Finlayson Goal | 76 - 83 |
| 14:11 | | J. Finlayson Goal | 76 - 83 |
| 12:59 | | W. Rioli Behind | 70 - 83 |
| 10:57 | | C. Windsor Goal | 69 - 83 |
| 9:36 | | C. Dixon Behind | 69 - 77 |
| 6:46 | | Rushed | 68 - 77 |
| 5:20 | | T. Sparrow Goal | 68 - 76 |
| 2:29 | | A. Neal-Bullen Goal | 68 - 70 |
| third Quarter | |||
| Time | Team | Play | Score |
| 32:55 | | M. Gawn Goal | 68 - 64 |
| 30:07 | | B. Brown Goal | 68 - 58 |
| 28:43 | | C. Rozee Behind | 68 - 52 |
| 27:11 | | T. Marshall Goal | 67 - 52 |
| 25:26 | | I. Soldo Goal | 61 - 52 |
| 24:21 | | O. Wines Behind | 55 - 52 |
| 22:54 | | Rushed | 54 - 52 |
| 19:29 | | D. Houston Behind | 54 - 51 |
| 16:28 | | A. Neal-Bullen Goal | 53 - 51 |
| 11:46 | | C. Dixon Behind | 53 - 45 |
| 10:19 | | W. Rioli Behind | 52 - 45 |
| 7:01 | | W. Rioli Goal | 51 - 45 |
| second Quarter | |||
| Time | Team | Play | Score |
| 28:47 | | J. Viney Goal | 45 - 45 |
| 24:54 | | D. Houston Goal | 45 - 39 |
| 20:51 | | D. Byrne-Jones Behind | 39 - 39 |
| 19:38 | | D. Byrne-Jones Goal | 38 - 39 |
| 16:01 | | Rushed | 32 - 39 |
| 13:59 | | K. Pickett Behind | 31 - 39 |
| 12:39 | | W. Rioli Goal | 31 - 38 |
| 8:09 | | K. Pickett Goal | 25 - 38 |
| 4:28 | | E. Langdon Goal | 25 - 32 |
| 0:16 | | T. Sparrow Goal | 25 - 26 |
| first Quarter | |||
| Time | Team | Play | Score |
| 32:15 | | C. Dixon Goal | 25 - 20 |
| 28:27 | | B. Brown Goal | 19 - 20 |
| 26:48 | | M. Gawn Behind | 19 - 14 |
| 24:05 | | C. Oliver Goal | 19 - 13 |
| 20:38 | | B. Fritsch Goal | 19 - 7 |
| 18:20 | | I. Soldo Behind | 19 - 1 |
| 15:06 | | F. Evans Goal | 18 - 1 |
| 2:52 | | J. McEntee Goal | 12 - 1 |
| 2:16 | | K. Chandler Behind | 6 - 1 |
| 0:18 | | D. Byrne-Jones Goal | 6 - 0 |
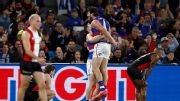
Marcus Bontempelli cleanly gathers a low ball and snaps home a beauty in one seamless motion.
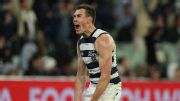
The Coleman Medal is awarded to the player who kicks the most goals throughout the AFL home and away season. Who is on track to win the award in 2026?
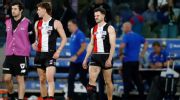
St Kilda's 22-point defeat to the Western Bulldogs at Marvel Stadium has been compounded by injuries to key duo Jack Sinclair and Tom De Koning.
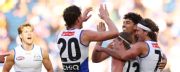
Having consigned their Fremantle debacle to history, North Melbourne are putting themselves back on track to break their AFL finals drought.
Adelaide icon Tony Modra has woken after facial surgery and remains in a serious, but stable, condition in hospital.
Two fourth quarter goals from Josh Rachele led Adelaide to a gutsy 17-point win over Melbourne.
| POS | Team | Pts. | % | Form |
|---|---|---|---|---|
| 1 |
 FRE FRE
|
52 | 144.4 | WWWWW |
| 2 |
 SYD SYD
|
48 | 143.7 | WLWWW |
| 3 |
 HAW HAW
|
38 | 113.5 | LWWLW |
| 4 |
 GEEL GEEL
|
36 | 120.6 | WLLWL |
| 5 |
 ADEL ADEL
|
36 | 113.2 | WLWWW |
| 6 |
 MELB MELB
|
36 | 104.2 | LLWWL |
| 7 |
 WB WB
|
36 | 92.8 | WWWLW |
| 8 |
 BL BL
|
32 | 108.4 | LLLWW |
| 9 |
 SUNS SUNS
|
28 | 105.3 | WLLLL |
| 10 |
 NMFC NMFC
|
28 | 90.7 | LWLWW |
| 11 |
 COLL COLL
|
26 | 101.5 | LWLLW |
| 12 |
 STK STK
|
24 | 100.6 | LLLWL |
| 13 |
 GWS GWS
|
24 | 100.3 | LWWLL |
| 14 |
 CARL CARL
|
24 | 91.1 | WWWWW |
| 15 |
 PORT PORT
|
16 | 98.7 | LLWLL |
| 16 |
 WCE WCE
|
16 | 72.7 | WLWLL |
| 17 |
 RICH RICH
|
8 | 61.3 | LWLLL |
| 18 |
 ESS ESS
|
4 | 70.4 | LLLLL |