


Game Information
Optus Stadium
| fourth Quarter | |||
|---|---|---|---|
| Time | Team | Play | Score |
| 27:36 |  | J. Cripps Goal | 43 - 98 |
| 25:07 |  | A. Naughton Goal | 37 - 98 |
| 21:36 | | C. Weightman Behind | 37 - 92 |
| 19:35 | | R. Garcia Goal | 37 - 91 |
| 18:13 | | Rushed | 37 - 85 |
| 17:09 | | T. Liberatore Behind | 37 - 84 |
| 14:50 | | M. Bontempelli Goal | 37 - 83 |
| 13:21 | | A. Naughton Goal | 37 - 77 |
| 11:29 | | A. Naughton Goal | 37 - 71 |
| 9:04 | | J. Macrae Goal | 37 - 65 |
| 4:51 | | T. Liberatore Behind | 37 - 59 |
| 3:44 | | O. Allen Behind | 37 - 58 |
| 1:11 | | T. English Behind | 36 - 58 |
| third Quarter | |||
| Time | Team | Play | Score |
| 29:03 | | J. Waterman Behind | 36 - 57 |
| 27:15 | | J. Johannisen Behind | 35 - 57 |
| 26:23 | | T. English Behind | 35 - 56 |
| 21:24 | | Rushed | 35 - 55 |
| 19:43 | | C. Weightman Goal | 35 - 54 |
| 15:13 | | O. Allen Goal | 35 - 48 |
| 13:27 | | O. Allen Goal | 29 - 48 |
| 12:11 | | B. Smith Goal | 23 - 48 |
| 11:06 | | Rushed | 23 - 42 |
| 7:41 | | J. Petruccelle Goal | 22 - 42 |
| 6:30 | | B. Smith Goal | 16 - 42 |
| second Quarter | |||
| Time | Team | Play | Score |
| 26:37 | | T. McLean Goal | 16 - 36 |
| 22:17 | | Josh J. Kennedy Behind | 16 - 30 |
| 19:52 | | D. Sheed Behind | 15 - 30 |
| 17:20 | | M. Bontempelli Goal | 14 - 30 |
| 15:14 | | Josh J. Kennedy Goal | 14 - 24 |
| 13:31 | | Josh J. Kennedy Behind | 8 - 24 |
| 9:19 | | A. Naughton Behind | 7 - 24 |
| 8:15 | | B. Smith Behind | 7 - 23 |
| 4:32 | | B. Williams Behind | 7 - 22 |
| 1:48 | | J. Bruce Behind | 7 - 21 |
| first Quarter | |||
| Time | Team | Play | Score |
| 26:10 | | B. Smith Behind | 7 - 20 |
| 24:53 | | M. Bontempelli Behind | 7 - 19 |
| 19:58 | | N. Naitanui Behind | 7 - 18 |
| 18:02 | | M. Bontempelli Goal | 6 - 18 |
| 15:41 | | Rushed | 6 - 12 |
| 10:59 | | A. Naughton Behind | 6 - 11 |
| 9:57 | | J. Bruce Behind | 6 - 10 |
| 7:27 | | A. Gaff Goal | 6 - 9 |
| 5:03 | | A. Naughton Goal | 0 - 9 |
| 4:13 | | J. Johannisen Behind | 0 - 3 |
| 2:18 | | Rushed | 0 - 2 |
| 1:28 | | Rushed | 0 - 1 |
Murphy Reid converts a brilliant play with a long solo run ending with a long-range goal from outside the arc.
The Demons weren't able to stop Shannon Neale as he kicked three straight goals early in the game.
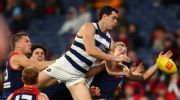
Melbourne's MCG golden run is over, losing to rejuvenated Geelong by 20 points.
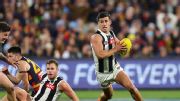
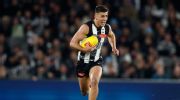
Nick Daicos kicks truly on the run to widen the margin for Collingwood.
The Dees have already exceeded expectations in Steven King's first season, but beating the Cats could prove they're genuine flag contenders and not just a great story, writes Rohan Connolly.
Round 20 of the 2026 AFL season kicks off with a Thursday night blockbuster between Adelaide and Collingwood, before another Friday night double header.
| POS | Team | Pts. | % | Form |
|---|---|---|---|---|
| 1 |
 FRE FRE
|
68 | 146.0 | WLWWW |
| 2 |
 SYD SYD
|
52 | 128.3 | WLWLL |
| 3 |
 HAW HAW
|
50 | 118.4 | WWLWW |
| 4 |
 BL BL
|
48 | 117.8 | WWWWW |
| 5 |
 ADEL ADEL
|
48 | 113.7 | LWWWL |
| 6 |
 MELB MELB
|
48 | 107.8 | LWWWL |
| 7 |
 COLL COLL
|
46 | 107.6 | WWWWW |
| 8 |
 GEEL GEEL
|
44 | 116.5 | LLLWW |
| 9 |
 WB WB
|
44 | 93.2 | LWLWW |
| 10 |
 STK STK
|
32 | 104.0 | WLWWL |
| 11 |
 GWS GWS
|
32 | 101.3 | LLWWL |
| 12 |
 CARL CARL
|
32 | 91.1 | WWWLL |
| 13 |
 NMFC NMFC
|
32 | 90.9 | WWLLL |
| 14 |
 SUNS SUNS
|
28 | 95.3 | LLLLL |
| 15 |
 PORT PORT
|
24 | 99.3 | LWWLL |
| 16 |
 WCE WCE
|
16 | 70.1 | LLLLL |
| 17 |
 ESS ESS
|
8 | 67.9 | LLLLW |
| 18 |
 RICH RICH
|
8 | 61.7 | LLLLL |