


Game Information
Optus Stadium
| fourth Quarter | |||
|---|---|---|---|
| Time | Team | Play | Score |
| 31:21 |  | Rushed | 49 - 136 |
| 29:12 |  | T. Kelly Behind | 49 - 135 |
| 26:31 | | O. Allen Goal | 48 - 135 |
| 22:44 | | D. Rioli Goal | 42 - 135 |
| 18:51 | | B. King Goal | 42 - 129 |
| 16:59 | | B. Long Goal | 42 - 123 |
| 15:32 | | Rushed | 42 - 117 |
| 14:20 | | Rushed | 42 - 116 |
| 13:10 | | B. King Behind | 42 - 115 |
| 11:31 | | J. Rogers Goal | 42 - 114 |
| 10:10 | | J. Rogers Goal | 42 - 108 |
| 8:20 | | B. King Goal | 42 - 102 |
| 5:22 | | L. Baker Behind | 42 - 96 |
| 2:20 | | M. Owies Goal | 41 - 96 |
| 1:11 | | Rushed | 35 - 96 |
| third Quarter | |||
| Time | Team | Play | Score |
| 28:59 | | E. Read Behind | 35 - 95 |
| 27:59 | | S. Clohesy Behind | 35 - 94 |
| 26:20 | | B. Long Goal | 35 - 93 |
| 25:04 | | M. Flynn Goal | 35 - 87 |
| 22:53 | | B. King Goal | 29 - 87 |
| 19:28 | | T. Miller Goal | 29 - 81 |
| 18:16 | | H. Reid Goal | 29 - 75 |
| 14:28 | | B. King Goal | 23 - 75 |
| 13:08 | | A. Sexton Behind | 23 - 69 |
| 10:27 | | J. Waterman Goal | 23 - 68 |
| 6:22 | | W. Graham Goal | 17 - 68 |
| 5:18 | | T. Miller Behind | 17 - 62 |
| 2:04 | | T. Brockman Behind | 17 - 61 |
| second Quarter | |||
| Time | Team | Play | Score |
| 29:52 | | Rushed | 16 - 61 |
| 26:46 | | N. Long Behind | 16 - 60 |
| 22:35 | | B. Long Goal | 15 - 60 |
| 19:37 | | N. Holman Behind | 15 - 54 |
| 17:05 | | B. Long Goal | 15 - 53 |
| 15:50 | | Rushed | 15 - 47 |
| 14:03 | | B. King Goal | 14 - 47 |
| 11:02 | | E. Hewett Behind | 14 - 41 |
| 8:19 | | E. Read Goal | 13 - 41 |
| 1:11 | | D. Rioli Goal | 13 - 35 |
| first Quarter | |||
| Time | Team | Play | Score |
| 29:05 | | E. Read Behind | 13 - 29 |
| 27:04 | | T. Miller Goal | 13 - 28 |
| 22:57 | | Rushed | 13 - 22 |
| 18:19 | | B. King Goal | 13 - 21 |
| 16:58 | | W. Graham Behind | 13 - 15 |
| 15:48 | | H. Reid Behind | 13 - 14 |
| 14:34 | | J. Rogers Goal | 12 - 14 |
| 11:27 | | B. King Behind | 12 - 8 |
| 8:48 | | O. Allen Goal | 12 - 7 |
| 7:28 | | B. Long Behind | 6 - 7 |
| 2:47 | | J. Waterman Goal | 6 - 6 |
| 1:05 | | E. Read Goal | 0 - 6 |
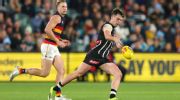
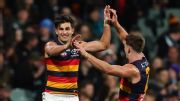
Port Adelaide's dynamic duo Zak Butters and Jason Horne-Francis have sparked a 26-point trouncing of Adelaide in one of the great Showdown upsets.
The youngster gathers the perfect crumb before kicking a huge goal to extend Port Adelaide's lead.
Adelaide livewire Josh Rachele gets the crowd on its feet with an early goal against the Power.
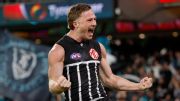
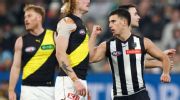
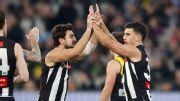
Collingwood have kicked the ton and gone back-to-back for only the second time this AFL season, beating Richmond by 34 points at the MCG.
A clever intercept from brother Josh helps set up Nick Daicos' third major vs. Richmond.
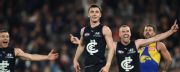
Josh Fraser says he's more focused on guiding Carlton through their growing pains rather than scratching his coaching itch after watching the Blues dismantle West Coast by 53 points at Marvel Stadium.
| POS | Team | Pts. | % | Form |
|---|---|---|---|---|
| 1 |
 FRE FRE
|
56 | 148.2 | WWWWW |
| 2 |
 SYD SYD
|
48 | 135.7 | LWWWL |
| 3 |
 HAW HAW
|
42 | 113.7 | WWLWW |
| 4 |
 GEEL GEEL
|
36 | 120.6 | WLLWL |
| 5 |
 BL BL
|
36 | 111.0 | LLWWW |
| 6 |
 ADEL ADEL
|
36 | 110.0 | LWWWL |
| 7 |
 MELB MELB
|
36 | 104.2 | LLWWL |
| 8 |
 WB WB
|
36 | 92.8 | WWWLW |
| 9 |
 NMFC NMFC
|
32 | 92.2 | WLWWW |
| 10 |
 COLL COLL
|
30 | 104.2 | WLLWW |
| 11 |
 SUNS SUNS
|
28 | 101.2 | LLLLL |
| 12 |
 CARL CARL
|
28 | 95.6 | WWWWW |
| 13 |
 STK STK
|
24 | 100.6 | LLLWL |
| 14 |
 GWS GWS
|
24 | 99.3 | WWLLL |
| 15 |
 PORT PORT
|
20 | 100.9 | LWLLW |
| 16 |
 WCE WCE
|
16 | 71.3 | LWLLL |
| 17 |
 RICH RICH
|
8 | 61.8 | WLLLL |
| 18 |
 ESS ESS
|
4 | 71.0 | LLLLL |