


Game Information
Adelaide Oval
| fourth Quarter | |||
|---|---|---|---|
| Time | Team | Play | Score |
| 30:33 |  | J. Richards Behind | 87 - 61 |
| 26:10 |  | Rushed | 86 - 61 |
| 24:21 | | J. Horne-Francis Goal | 86 - 60 |
| 21:58 | | M. Georgiades Goal | 80 - 60 |
| 20:00 | | J. Horne-Francis Goal | 74 - 60 |
| 16:18 | | T. Boak Goal | 68 - 60 |
| 9:35 | | W. Rioli Behind | 62 - 60 |
| 5:15 | | D. Byrne-Jones Goal | 61 - 60 |
| 4:08 | | M. Georgiades Behind | 55 - 60 |
| third Quarter | |||
| Time | Team | Play | Score |
| 30:09 | | J. Richards Behind | 54 - 60 |
| 27:47 | | J. Shanahan Goal | 53 - 60 |
| 26:20 | | J. Shanahan Behind | 53 - 54 |
| 23:37 | | J. Richards Behind | 53 - 53 |
| 20:12 | | Z. Butters Behind | 52 - 53 |
| 15:31 | | J. Horne-Francis Behind | 51 - 53 |
| 13:01 | | J. Richards Goal | 50 - 53 |
| 10:44 | | M. Georgiades Behind | 44 - 53 |
| 7:27 | | M. Georgiades Behind | 43 - 53 |
| 4:04 | | J. Williams Goal | 42 - 53 |
| 1:33 | | J. Horne-Francis Goal | 42 - 47 |
| second Quarter | |||
| Time | Team | Play | Score |
| 27:48 | | J. Lukosius Behind | 36 - 47 |
| 25:57 | | M. Georgiades Behind | 35 - 47 |
| 23:58 | | L. Baker Behind | 34 - 47 |
| 22:33 | | D. Byrne-Jones Goal | 34 - 46 |
| 18:20 | | M. Georgiades Goal | 28 - 46 |
| 17:24 | | J. Lukosius Behind | 22 - 46 |
| 15:12 | | H. Reid Behind | 21 - 46 |
| 11:41 | | L. Baker Goal | 21 - 45 |
| 6:48 | | M. Georgiades Behind | 21 - 39 |
| 4:01 | | J. Richards Goal | 20 - 39 |
| first Quarter | |||
| Time | Team | Play | Score |
| 33:07 | | M. Flynn Goal | 14 - 39 |
| 30:04 | | H. Reid Goal | 14 - 33 |
| 25:32 | | H. Reid Behind | 14 - 27 |
| 24:29 | | M. Owies Behind | 14 - 26 |
| 22:37 | | M. Bergman Goal | 14 - 25 |
| 19:15 | | T. Brockman Goal | 8 - 25 |
| 17:09 | | J. Cripps Behind | 8 - 19 |
| 15:50 | | Rushed | 8 - 18 |
| 14:03 | | J. Williams Goal | 7 - 18 |
| 9:56 | | Rushed | 7 - 12 |
| 7:39 | | T. Dewar Goal | 6 - 12 |
| 4:11 | | Bailey J. Williams Goal | 6 - 6 |
| 1:31 | | M. Georgiades Goal | 6 - 0 |
Round 17 of the 2026 AFL season kicks off with a Thursday night blockbuster between Geelong and Brisbane at GMHBA Stadium. Then, on Friday evening, Sydney and the Western Bulldogs do battle at the SCG.
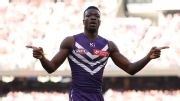
Michael Frederick catches fire in the first term for the Dockers, booting the opening three goals of the game within the space of nine minutes.
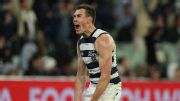
Chad Warner was a clear best on ground in a six-goal loss, and Zak Butters starred in what might have been his last Showdown. But Damien Hardwick needs to find something, and fast. Here's whose stocks are up and down after Round 16.
The Coleman Medal is awarded to the player who kicks the most goals throughout the AFL home and away season. Who is on track to win the award in 2026?
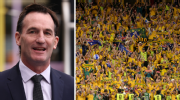
The World Cup serves as a timely reminder that if AFL wants to thrive for another century, it must become a game that more Australians feel belongs to them, writes Rohan Connolly.
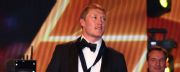
The Brownlow Medal is the highest individual honour in the AFL. In 2026, ESPN is giving you an advantage with our one-of-a-kind predictor.
| POS | Team | Pts. | % | Form |
|---|---|---|---|---|
| 1 |
 FRE FRE
|
56 | 148.2 | WWWWW |
| 2 |
 SYD SYD
|
48 | 135.7 | LWWWL |
| 3 |
 HAW HAW
|
42 | 113.7 | WWLWW |
| 4 |
 GEEL GEEL
|
36 | 120.6 | WLLWL |
| 5 |
 BL BL
|
36 | 111.0 | LLWWW |
| 6 |
 ADEL ADEL
|
36 | 110.0 | LWWWL |
| 7 |
 MELB MELB
|
36 | 104.2 | LLWWL |
| 8 |
 WB WB
|
36 | 92.8 | WWWLW |
| 9 |
 NMFC NMFC
|
32 | 92.2 | WLWWW |
| 10 |
 COLL COLL
|
30 | 104.2 | WLLWW |
| 11 |
 SUNS SUNS
|
28 | 101.2 | LLLLL |
| 12 |
 CARL CARL
|
28 | 95.6 | WWWWW |
| 13 |
 STK STK
|
24 | 100.6 | LLLWL |
| 14 |
 GWS GWS
|
24 | 99.3 | WWLLL |
| 15 |
 PORT PORT
|
20 | 100.9 | LWLLW |
| 16 |
 WCE WCE
|
16 | 71.3 | LWLLL |
| 17 |
 RICH RICH
|
8 | 61.8 | WLLLL |
| 18 |
 ESS ESS
|
4 | 71.0 | LLLLL |