

Game Information
IKON Park
| fourth Quarter | |||
|---|---|---|---|
| Time | Team | Play | Score |
| 28:32 |  | J. Daicos Behind | 49 - 132 |
| 22:02 |  | J. Hopper Goal | 49 - 131 |
| 18:45 | | B. Hill Goal | 43 - 131 |
| 17:46 | | B. McCreery Behind | 43 - 125 |
| 16:42 | | L. Schultz Behind | 43 - 124 |
| 13:22 | | J. Elliott Behind | 43 - 123 |
| 10:38 | | D. Houston Behind | 43 - 122 |
| 7:36 | | Rushed | 43 - 121 |
| 6:00 | | S. Green Behind | 42 - 121 |
| 2:19 | | L. Fawcett Behind | 41 - 121 |
| 0:34 | | T. Membrey Goal | 40 - 121 |
| third Quarter | |||
| Time | Team | Play | Score |
| 25:25 | | K. McIntosh Goal | 40 - 115 |
| 18:23 | | D. Cameron Goal | 34 - 115 |
| 15:24 | | J. Elliott Goal | 34 - 109 |
| 8:37 | | B. Mihocek Goal | 34 - 103 |
| 5:35 | | J. Elliott Goal | 34 - 97 |
| 3:52 | | B. Hill Goal | 34 - 91 |
| 2:18 | | T. Membrey Goal | 34 - 85 |
| second Quarter | |||
| Time | Team | Play | Score |
| 31:44 | | B. Hill Goal | 34 - 79 |
| 29:46 | | B. Mihocek Goal | 34 - 73 |
| 28:07 | | H. Armstrong Behind | 34 - 67 |
| 26:16 | | S. Sidebottom Goal | 33 - 67 |
| 24:09 | | D. McStay Goal | 33 - 61 |
| 20:38 | | H. Perryman Goal | 33 - 55 |
| 19:28 | | J. Ross Goal | 33 - 49 |
| 17:46 | | B. Mihocek Goal | 27 - 49 |
| 14:23 | | T. Dow Behind | 27 - 43 |
| 12:11 | | R. Mansell Goal | 26 - 43 |
| 11:03 | | T. Nankervis Behind | 20 - 43 |
| 9:35 | | J. Daicos Goal | 19 - 43 |
| 7:23 | | Rushed | 19 - 37 |
| 3:20 | | J. Bauer Goal | 19 - 36 |
| first Quarter | |||
| Time | Team | Play | Score |
| 27:15 | | R. Mansell Behind | 13 - 36 |
| 25:26 | | J. Short Behind | 12 - 36 |
| 24:38 | | R. Mansell Behind | 11 - 36 |
| 22:05 | | D. McStay Goal | 10 - 36 |
| 21:16 | | H. Armstrong Behind | 10 - 30 |
| 19:24 | | T. Membrey Goal | 9 - 30 |
| 18:11 | | D. Houston Goal | 9 - 24 |
| 17:00 | | S. Green Behind | 9 - 18 |
| 14:15 | | Rushed | 8 - 18 |
| 10:56 | | J. Bauer Goal | 7 - 18 |
| 8:22 | | T. Membrey Goal | 1 - 18 |
| 7:21 | | J. Trezise Behind | 1 - 12 |
| 5:10 | | B. Mihocek Goal | 0 - 12 |
| 2:31 | | B. Hill Goal | 0 - 6 |
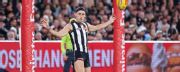
Jack Dalton slots his maiden AFL goal after a standout defensive display.
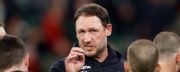
Sydney coach Dean Cox has warned his side they can't be one-trick ponies and must find another gear after their Brisbane humbling.
After the AFL warned players and coaches about public criticism, Mason Cox has said players should be allowed to voice concerns about league processes without being the fear of being fined.
On Red Time, Mason Cox posits that Kangaroo Jy Simpkin and Gold Coast coach Damien Hardwick should be able to voice their opinions without being fined by the AFL.
Interim Carlton coach Josh Fraser can only laugh at the weekly questions about the potential to win the job on a full-time basis.
Darcy Moore is facing a fight to return this season as the Collingwood captain tries to get on top of persistent soft-tissue injuries.
| POS | Team | Pts. | % | Form |
|---|---|---|---|---|
| 1 |
 FRE FRE
|
52 | 144.4 | WWWWW |
| 2 |
 SYD SYD
|
48 | 135.7 | LWWWL |
| 3 |
 HAW HAW
|
42 | 113.7 | WWLWW |
| 4 |
 GEEL GEEL
|
36 | 120.6 | WLLWL |
| 5 |
 ADEL ADEL
|
36 | 113.2 | WLWWW |
| 6 |
 BL BL
|
36 | 111.0 | LLWWW |
| 7 |
 MELB MELB
|
36 | 104.2 | LLWWL |
| 8 |
 WB WB
|
36 | 92.8 | WWWLW |
| 9 |
 SUNS SUNS
|
28 | 105.3 | WLLLL |
| 10 |
 NMFC NMFC
|
28 | 90.7 | LWLWW |
| 11 |
 COLL COLL
|
26 | 101.5 | LWLLW |
| 12 |
 STK STK
|
24 | 100.6 | LLLWL |
| 13 |
 GWS GWS
|
24 | 99.3 | WWLLL |
| 14 |
 CARL CARL
|
24 | 91.1 | WWWWW |
| 15 |
 PORT PORT
|
16 | 98.7 | LLWLL |
| 16 |
 WCE WCE
|
16 | 72.7 | WLWLL |
| 17 |
 RICH RICH
|
8 | 61.3 | LWLLL |
| 18 |
 ESS ESS
|
4 | 70.4 | LLLLL |